Live signal board

    Simulated backtest — not real performance · Last run 2026-11-05T00:04:00Z ·
    ▶ How to read this page · 5 min
    ★ Flagship strategy
    Rotation 1D
    BTC · ETH · SOL · SUI · PAXG · rotation or cash · one decision a day (00:00 UTC)
    IN-SAMPLE

    One card. In or out, decided once a day at the close.

    Today's decision · for subscribersSee today's decision · 7 days freeIncluded in Intermediate
    Last cash-to-cash cycle

    Loading published trade history…

    Simulated backtest · not real performance · not investment advice. In-sample.
    Performance vs holding ∨
    Strategy vs buy & hold
    StrategyWINNER
    $1,000 → $571,960
    571.96×
    Max DD
    24.3%
    CAGR
    +422.2%
    MAR
    17.35
    Equal-weight basket
    $1,000 → $3,866
    3.87×
    Max DD
    65.2%
    CAGR
    +42.2%
    MAR
    0.65

    Window 2023-01-01 → 2026-11-04. Simulated backtest, USD — not real performance, not investment advice.
    ETH 1D
    ETHUSDT · long or cash · one decision a day (00:00 UTC)

    One card. In or out, decided once a day at the close.

    Today's decision · for subscribersSee today's decision · 7 days freeIncluded in Intermediate
    Last closed trade

    Loading published trade history…

    Simulated backtest · not real performance · not investment advice.
    ETH · market price unavailable—
    Performance vs holding ∨
    Strategy vs buy & hold
    StrategyWINNER
    $1,000 → $9,616
    9.62×
    Max DD
    14.1%
    CAGR
    +80.3%
    MAR
    5.70
    Buy & hold
    $1,000 → $2,020
    2.02×
    Max DD
    67.6%
    CAGR
    +20.1%
    MAR
    0.30

    Window 2023-01-01 → 2026-11-04. Simulated backtest, USD — not real performance, not investment advice.

    SOL 12H
    SOLUSDT · long or cash · two decisions a day (00:00 and 12:00 UTC)

    One card. In or out, decided twice a day at the close.

    Today's decision · for subscribersSee today's decision · 7 days freeIncluded in Intermediate
    Last closed trade

    Loading published trade history…

    Simulated backtest · not real performance · not investment advice.
    SOL · market price unavailable—
    Performance vs holding ∨
    Strategy vs buy & hold
    Strategy
    $1,000 → $8,053
    8.05×
    Max DD
    27.0%
    CAGR
    +72.1%
    MAR
    2.67
    Buy & holdWINNER
    $1,000 → $9,628
    9.63×
    Max DD
    78.3%
    CAGR
    +80.3%
    MAR
    1.03

    Window 2023-01-01 → 2026-11-04. Simulated backtest, USD — not real performance, not investment advice.
    BTC 12H
    BTCUSDT · long or cash · two decisions a day (00:00 and 12:00 UTC)

    One card. In or out, decided twice a day at the close.

    Today's decision · for subscribersSee today's decision · 7 days freeIncluded in Intermediate
    Last closed trade

    Loading published trade history…

    Simulated backtest · not real performance · not investment advice.
    BTC · market price unavailable—
    Performance vs holding ∨
    Strategy vs buy & hold
    StrategyWINNER
    $1,000 → $10,290
    10.29×
    Max DD
    16.7%
    CAGR
    +83.5%
    MAR
    5.01
    Buy & hold
    $1,000 → $4,862
    4.86×
    Max DD
    53.0%
    CAGR
    +50.9%
    MAR
    0.96

    Window 2023-01-01 → 2026-11-04. Simulated backtest, USD — not real performance, not investment advice.

    SUI 1D
    SUIUSDT · long or cash · one decision a day (00:00 UTC)

    One card. In or out, decided once a day at the close.

    Today's decision · for subscribersSee today's decision · 7 days freeIncluded in Intermediate
    Last closed trade

    Loading published trade history…

    Simulated backtest · not real performance · not investment advice.
    SUI · market price unavailable—
    Performance vs holding ∨
    Strategy vs buy & hold
    StrategyWINNER
    $1,000 → $3,109
    3.11×
    Max DD
    32.6%
    CAGR
    +76.4%
    MAR
    2.34
    Buy & hold
    $1,000 → $502
    0.50×
    Max DD
    87.7%
    CAGR
    -29.1%
    MAR
    -0.33

    Window 2024-11-04 → 2026-11-04. Simulated backtest, USD — not real performance, not investment advice.

    MSTR 1D
    MSTR · long or cash · one decision per NYSE close
    IN-SAMPLE

    One card. In or out, decided once a day at the close.

    Today's decision · for subscribersSee today's decision · 7 days freeIncluded in Intermediate
    Last closed trade

    Loading published trade history…

    Simulated backtest · not real performance · not investment advice.
    Performance vs holding ∨
    Strategy vs buy & hold
    StrategyWINNER
    $1,000 → $71,085
    71.09×
    Max DD
    25.4%
    CAGR
    +203.9%
    MAR
    8.04
    Buy & hold
    $1,000 → $9,822
    9.82×
    Max DD
    82.6%
    CAGR
    +81.4%
    MAR
    0.99

    Window 2023-01-03 → 2026-11-04. Simulated backtest, USD — not real performance, not investment advice.

    SOL 1D
    SOLUSDT · long or cash · one decision a day (00:00 UTC)

    One card. In or out, decided once a day at the close.

    Today's decision · for subscribersSee today's decision · 7 days freeIncluded in Intermediate
    Last closed trade

    Loading published trade history…

    Simulated backtest · not real performance · not investment advice.
    SOL · market price unavailable—
    Performance vs holding ∨
    Strategy vs buy & hold
    StrategyWINNER
    $1,000 → $17,263
    17.26×
    Max DD
    19.7%
    CAGR
    +109.9%
    MAR
    5.58
    Buy & hold
    $1,000 → $9,571
    9.57×
    Max DD
    76.3%
    CAGR
    +80.0%
    MAR
    1.05

    Window 2023-01-01 → 2026-11-04. Simulated backtest, USD — not real performance, not investment advice.

    TSLA 1D
    TSLA · long or cash · one decision per NYSE close

    One card. In or out, decided once a day at the close.

    Today's decision · for subscribersSee today's decision · 7 days freeIncluded in Intermediate
    Last closed trade

    Loading published trade history…

    Simulated backtest · not real performance · not investment advice.
    Performance vs holding ∨
    Strategy vs buy & hold
    StrategyWINNER
    $1,000 → $5,443
    5.44×
    Max DD
    17.5%
    CAGR
    +55.5%
    MAR
    3.17
    Buy & hold
    $1,000 → $3,564
    3.56×
    Max DD
    53.8%
    CAGR
    +39.3%
    MAR
    0.73

    Window 2023-01-01 → 2026-11-04. Simulated backtest, USD — not real performance, not investment advice.

    PAXG 1D
    PAXGUSDT · long or cash · one decision a day (00:00 UTC)

    One card. In or out, decided once a day at the close.

    Today's decision · for subscribersSee today's decision · 7 days freeIncluded in Intermediate
    Last closed trade

    Loading published trade history…

    Simulated backtest · not real performance · not investment advice.
    PAXG · market price unavailable—
    Performance vs holding ∨
    Strategy vs buy & hold
    StrategyWINNER
    $1,000 → $2,381
    2.38×
    Max DD
    15.2%
    CAGR
    +25.3%
    MAR
    1.67
    Buy & hold
    $1,000 → $2,227
    2.23×
    Max DD
    29.6%
    CAGR
    +23.2%
    MAR
    0.78

    Window 2023-01-01 → 2026-11-04. Simulated backtest, USD — not real performance, not investment advice.

    PAXG 12H
    PAXGUSDT · long or cash · two decisions a day (00:00 and 12:00 UTC)

    One card. In or out, decided twice a day at the close.

    Today's decision · for subscribersSee today's decision · 7 days freeIncluded in Intermediate
    Last closed trade

    Loading published trade history…

    Simulated backtest · not real performance · not investment advice.
    PAXG · market price unavailable—
    Performance vs holding ∨
    Strategy vs buy & hold
    StrategyWINNER
    $1,000 → $2,323
    2.32×
    Max DD
    15.4%
    CAGR
    +24.5%
    MAR
    1.59
    Buy & hold
    $1,000 → $2,233
    2.23×
    Max DD
    29.9%
    CAGR
    +23.3%
    MAR
    0.78

    Window 2023-01-01 → 2026-11-04. Simulated backtest, USD — not real performance, not investment advice.

    Rotation 1D Proportional
    BTC · ETH · SOL · SUI · PAXG · rotation or cash · one decision a day (00:00 UTC)
    IN-SAMPLE

    One card. In or out, decided once a day at the close.

    Today's decision · for subscribersSee today's decision · 7 days freeIncluded in Intermediate
    Last cash-to-cash cycle

    Loading published trade history…

    Simulated backtest · not real performance · not investment advice. In-sample.
    Performance vs holding ∨
    Strategy vs buy & hold
    StrategyWINNER
    $1,000 → $424,653
    424.65×
    Max DD
    22.6%
    CAGR
    +383.2%
    MAR
    16.94
    Equal-weight basket
    $1,000 → $6,789
    6.79×
    Max DD
    75.0%
    CAGR
    +64.6%
    MAR
    0.86

    Window 2023-01-01 → 2026-11-04. Simulated backtest, USD — not real performance, not investment advice.

    Rotation 12H
    BTC · ETH · SOL · SUI · PAXG · rotation or cash · two decisions a day (00:00 and 12:00 UTC)
    IN-SAMPLE

    One card. In or out, decided twice a day at the close.

    Today's decision · for subscribersSee today's decision · 7 days freeIncluded in Intermediate
    Last cash-to-cash cycle

    Loading published trade history…

    Simulated backtest · not real performance · not investment advice. In-sample.
    Performance vs holding ∨
    Strategy vs buy & hold
    StrategyWINNER
    $1,000 → $170,541
    170.54×
    Max DD
    25.8%
    CAGR
    +281.1%
    MAR
    10.92
    Equal-weight basket
    $1,000 → $3,879
    3.88×
    Max DD
    66.8%
    CAGR
    +42.3%
    MAR
    0.63

    Window 2023-01-01 → 2026-11-04. Simulated backtest, USD — not real performance, not investment advice.

    Rotation 1D L +Stocks
    BTC · ETH · SOL · SUI · PAXG · MSTR · TSLA · rotation or cash · one decision a day (00:00 UTC)
    IN-SAMPLE

    One card. In or out, decided once a day at the close.

    Today's decision · for subscribersSee today's decision · 7 days freeIncluded in Intermediate
    Last cash-to-cash cycle

    Loading published trade history…

    Simulated backtest · not real performance · not investment advice. In-sample.
    Performance vs holding ∨
    Strategy vs buy & hold
    StrategyWINNER
    $1,000 → $2,187,452
    2187.45×
    Max DD
    22.6%
    CAGR
    +640.5%
    MAR
    28.31
    Equal-weight basket
    $1,000 → $6,789
    6.79×
    Max DD
    75.0%
    CAGR
    +64.6%
    MAR
    0.86

    Window 2023-01-01 → 2026-11-04. Simulated backtest, USD — not real performance, not investment advice.

    Portfolio 1D Stocks
    MSTR · TSLA · GLD · rotation or cash · one decision per NYSE close
    IN-SAMPLE

    One card. In or out, decided once a day at the close.

    Today's decision · for subscribersSee today's decision · 7 days freeIncluded in Intermediate
    Last cash-to-cash cycle

    Loading published trade history…

    Simulated backtest · not real performance · not investment advice. In-sample.
    Performance vs holding ∨
    Strategy vs buy & hold
    StrategyWINNER
    $1,000 → $272,144
    272.14×
    Max DD
    21.7%
    CAGR
    +331.3%
    MAR
    15.25
    Equal-weight basket
    $1,000 → $6,631
    6.63×
    Max DD
    74.1%
    CAGR
    +63.8%
    MAR
    0.86

    Window 2023-01-01 → 2026-11-04. Simulated backtest, USD — not real performance, not investment advice.

    How to read this board

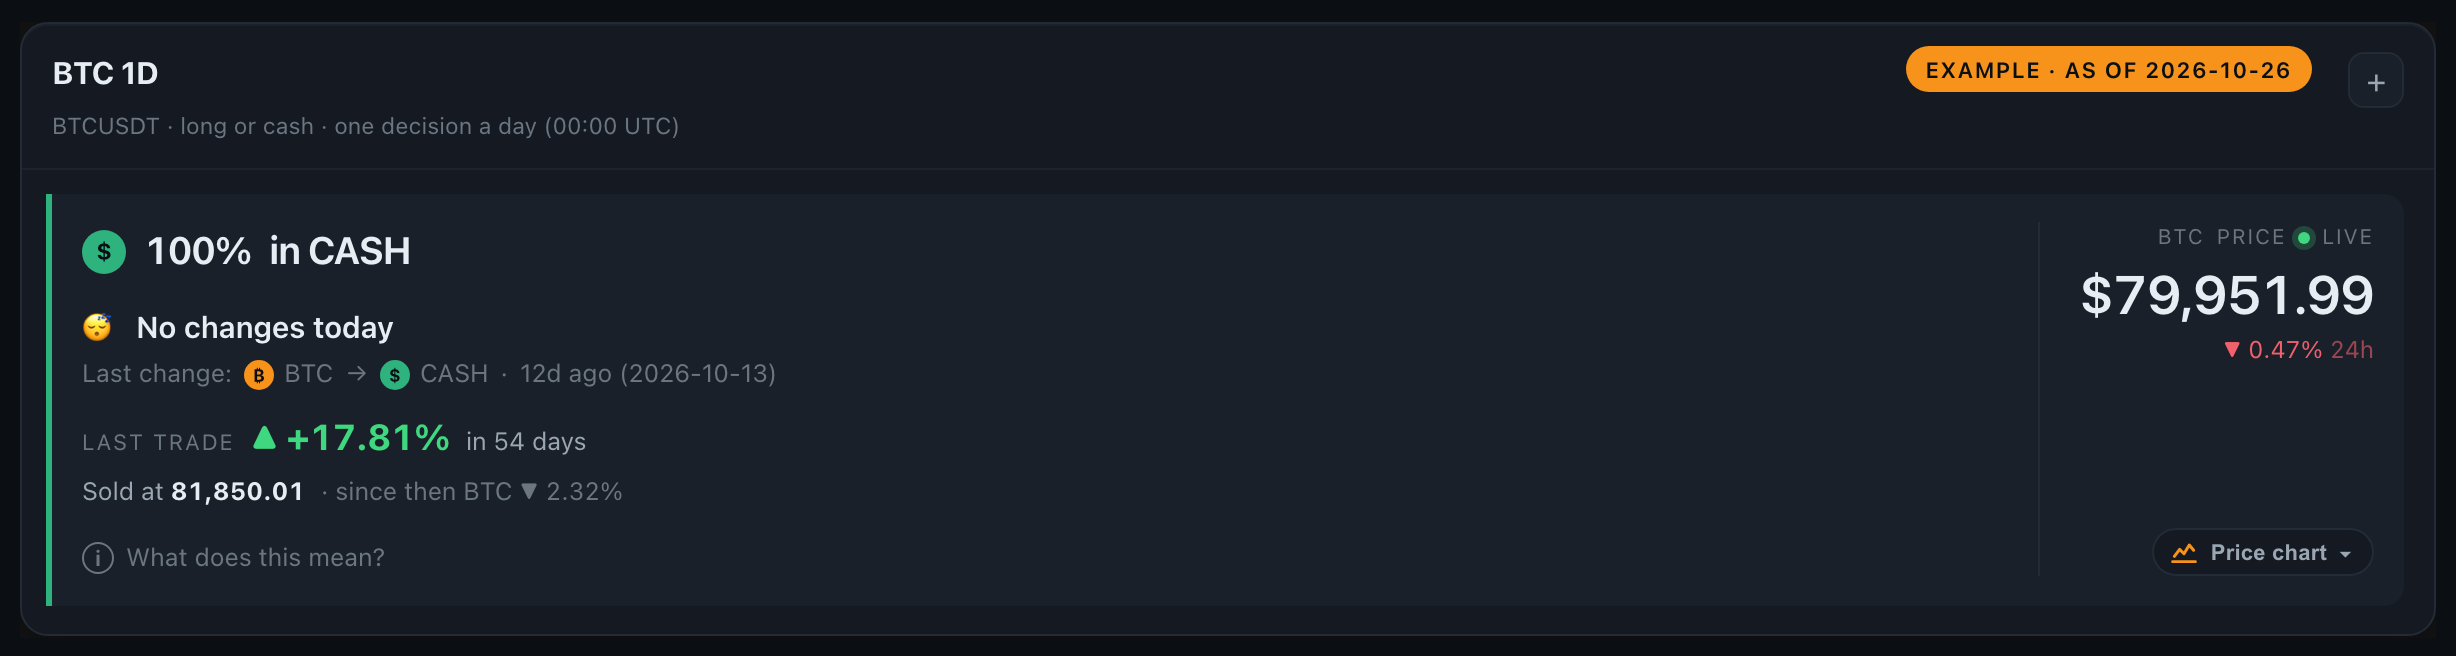
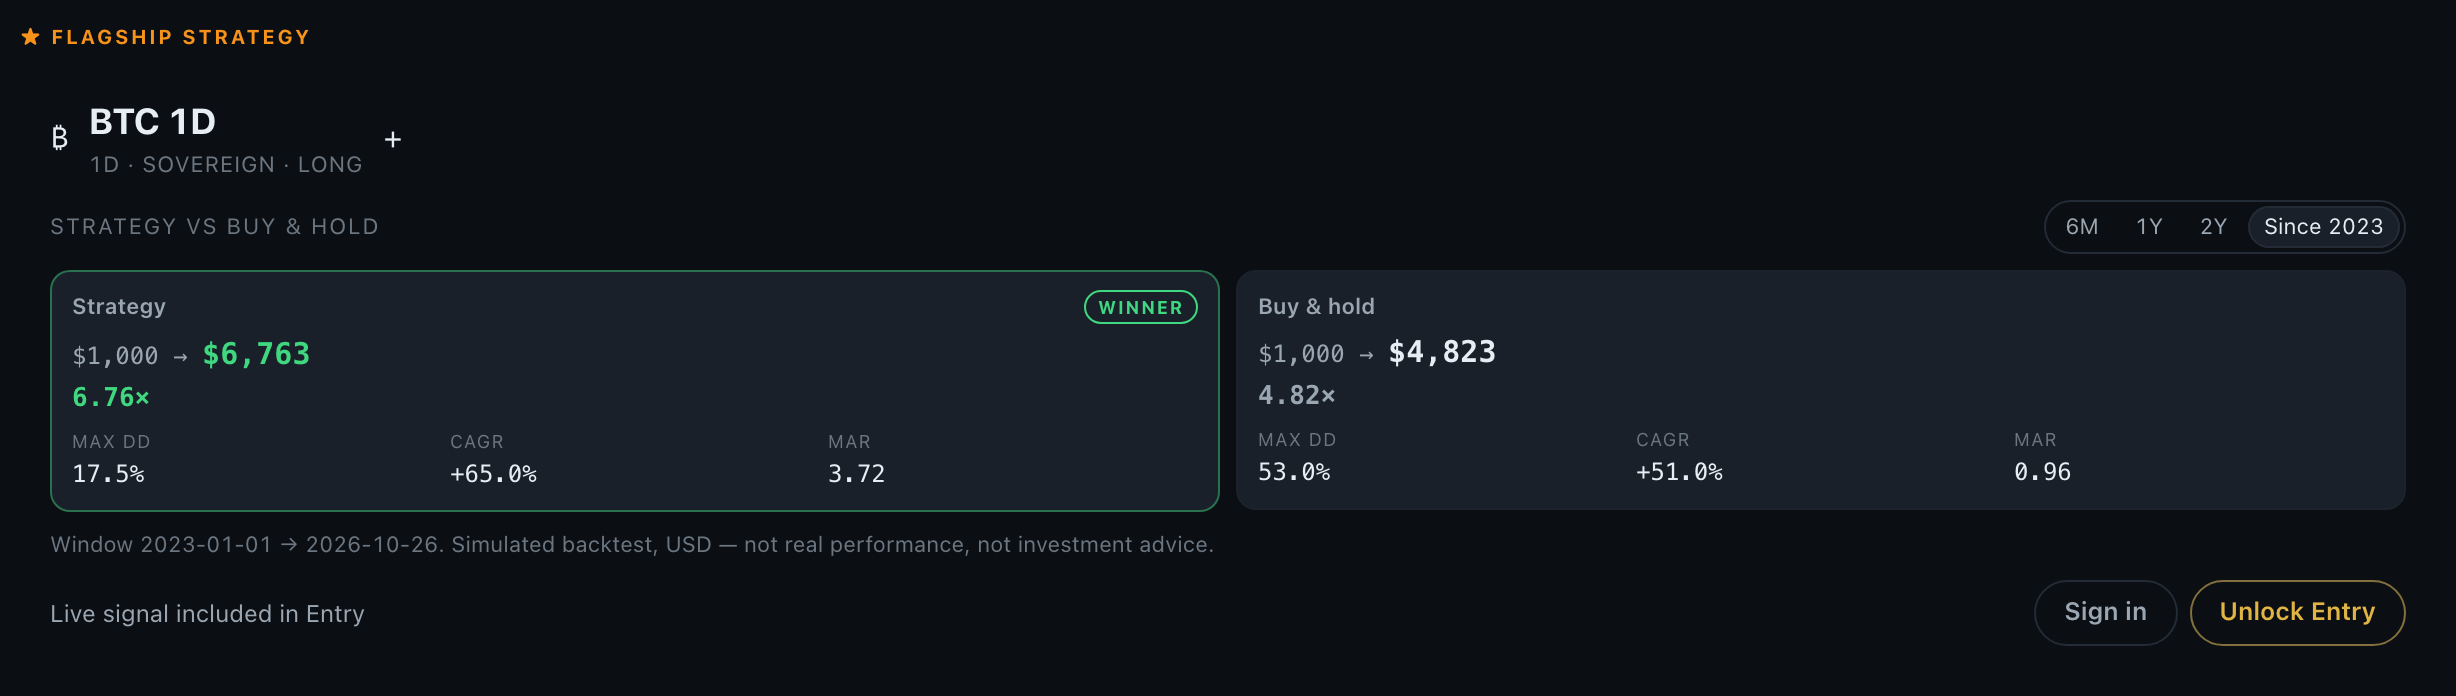
    Every card is one strategy. Its backtest numbers are open to everyone; its live position today is shown only to accounts whose tier includes it. Locked cards show a placeholder and the tier that unlocks it.

    An example card: position today, last change, last trade, live priceA locked card: backtest numbers open, live signal behind Sign in and Unlock
    Click to enlarge

    Three levels. Entry decides once a day and only ever buys. Intermediate adds 12-hour and rotation strategies — faster to react, more trades, more fees. Expert can also sell short, so it can make money in falling markets, at the cost of deeper drawdowns and more to manage. Each level includes everything from the levels below it. Switch levels on and off to see what each one adds.

    The three tier tabs: Entry, Intermediate, Expert
    Click to enlarge

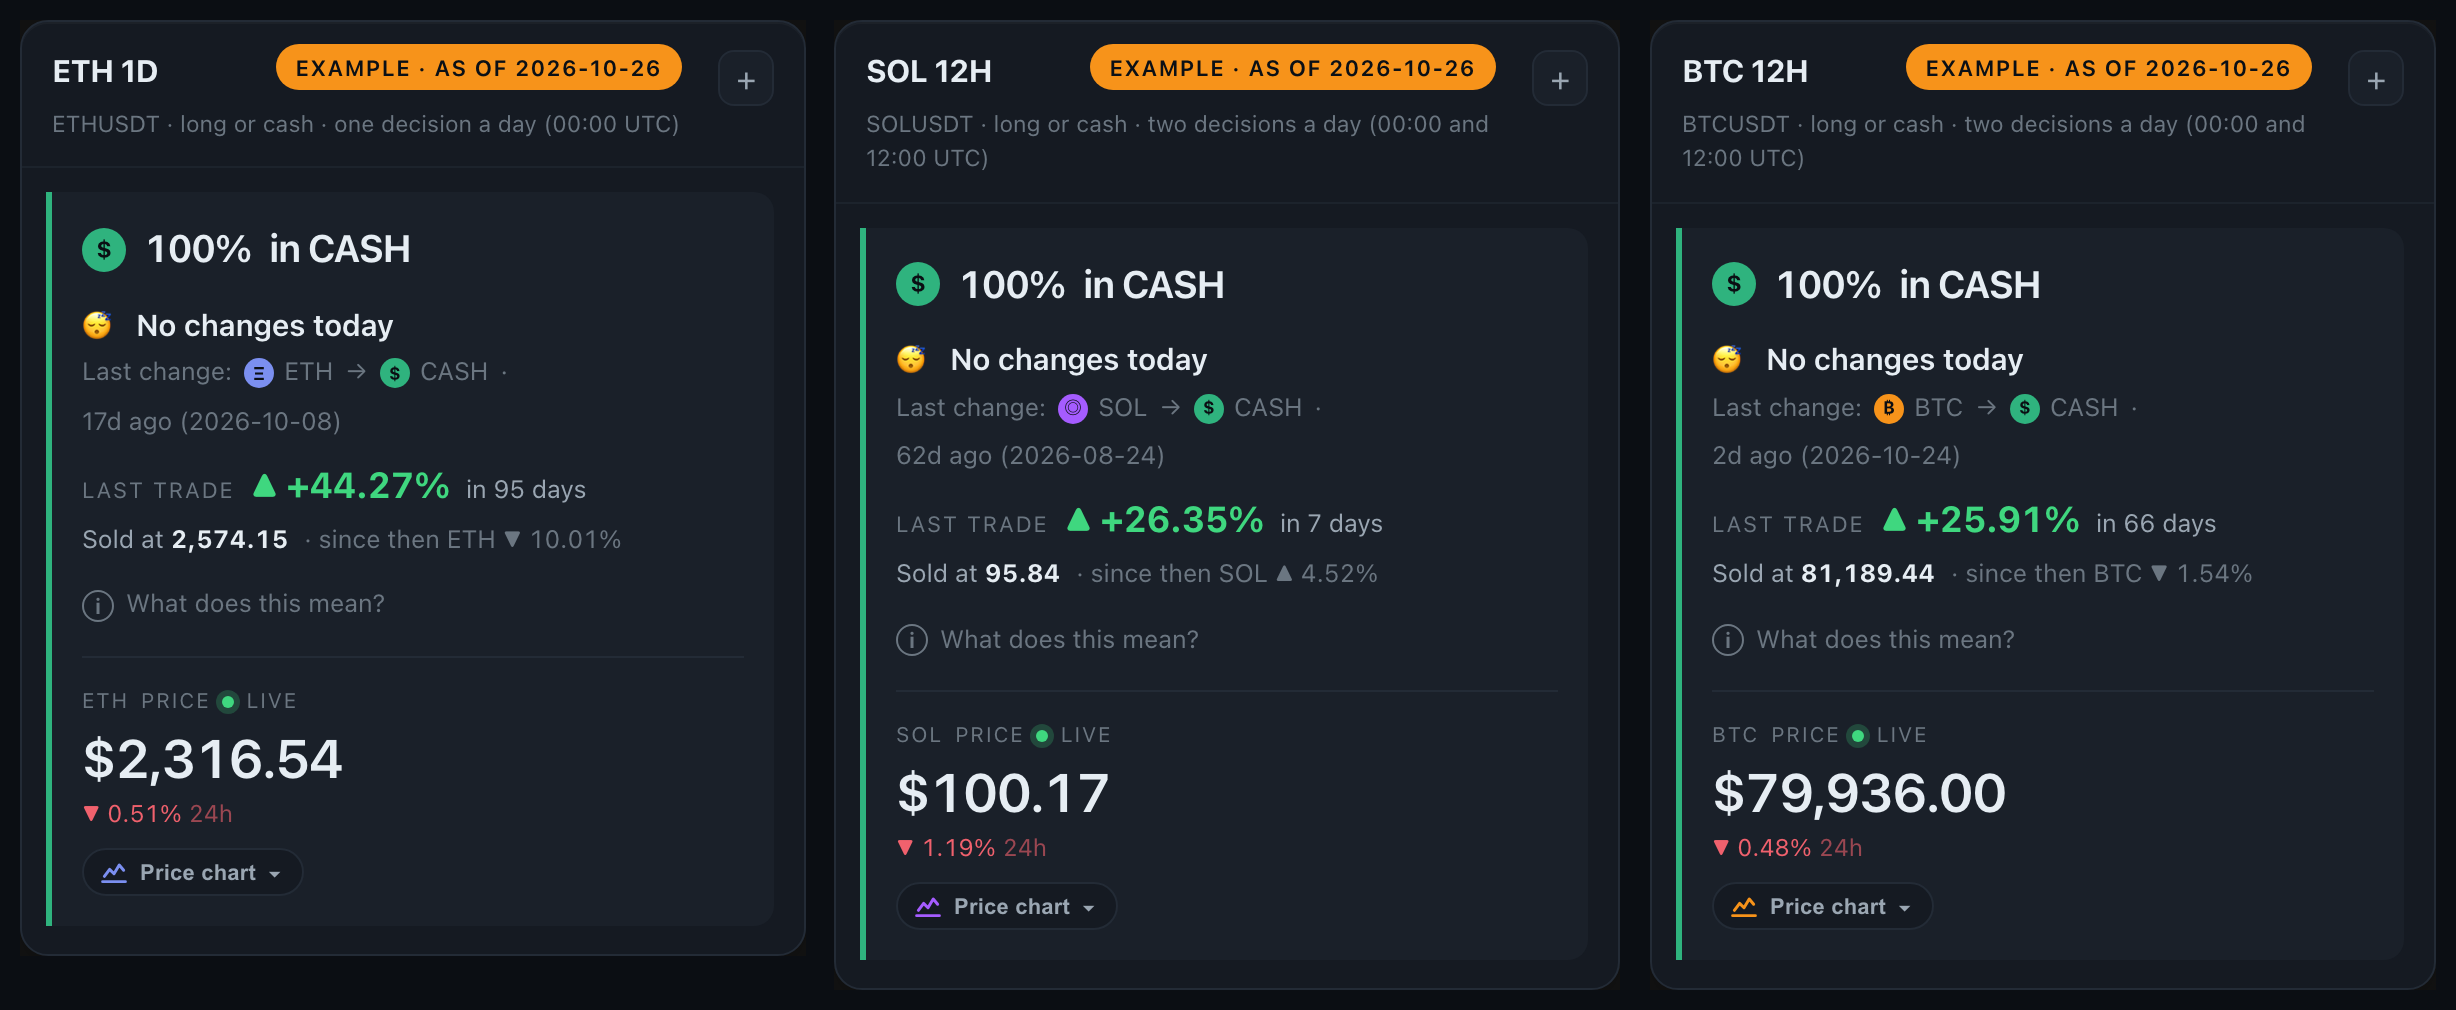
    The colour is the asset. Orange is BTC, indigo ETH, purple SOL, blue SUI, amber PAXG (gold), green CASH — parked, out of the market.

    Three example cards with the asset colour on the icon and the coin tag
    Click to enlarge

    Long/Short KPIs are preliminary and not a commercial claim.

    History is a simulated backtest, not money that was made. It shows how the rules would have behaved on past prices, which is useful and is not a promise. None of this is investment advice.

    How to read this page

    How to read the Catalog · 4 min 57 s

    Video coming soon
    What does each plan include? Inside the Plans · 6 min →

    New here? How a Strategya card works

    All strategies

    Simulate an amount in each strategy →