One picture, one decision a day: how a Strategya card works
A 2-minute tour of a Strategya card: one position per asset, decided once a day at the candle close, from a rule tested on years of data. Simulated backtest, not real performance.
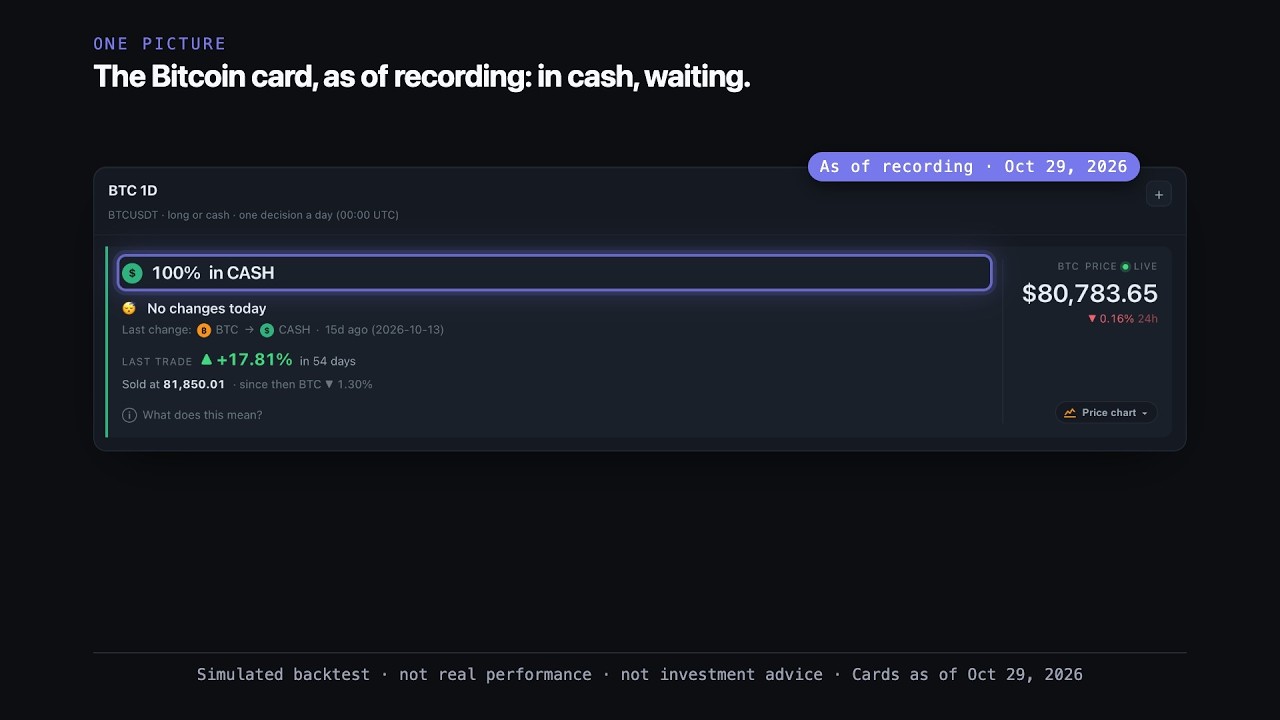
Table of contents
In 3 lines
A Strategya card shows one thing: where a rule stands today for one asset, in cash or in the market, decided once a day at the candle close.
Behind each card there is a strategy born in TradingView and tested on years of data. The card shows you only the result.
Every figure is a simulated backtest. Nothing here is real performance or financial advice.
Chapters
0:00 Why people lose: deciding with feelings
0:12 The Bitcoin card, line by line
0:33 Tap the plus: multiplier, curve, history, trades, stats
1:07 Behind every card there is a strategy
1:38 One card per asset, and Rotation
1:52 Make it yours: by hand, with Signum, or through your AI assistant
Why people lose
Crypto moves fast. Everyone buys at the top and everyone panics at the bottom. People do not lose because they picked the wrong coin. They lose because they decided with their feelings.
The Bitcoin card, line by line
Strategya fixes that with one picture. This is the Bitcoin card today: one hundred percent in cash, waiting. It tells you the last change, the last trade, and the live price since then. One decision a day, at the close of the candle. No charts, no TradingView. You do not need to be a trader. This is built for everyone.
Tap the plus
Want the details? Tap the plus. First, the multiplier: what one thousand dollars became with the rule, right next to just holding Bitcoin. Then the curve, month by month. The flat parts are not inactivity: that is protection, the rule sitting in cash. Then the position history: green is cash, orange is Bitcoin. Then every trade, in plain words. And if you want more, the stats are there too, like a strategy tester, with returns over six months, one year, two years, or since the start. At the bottom, every month and every year.
Behind every card there is a strategy
It was born in TradingView and tested on years of data. Today the same engine runs on our side, and the card shows you only the result. On the chart, green means the rule is in the market and red means it is out. The blue line is the money: it goes flat when the rule sits in cash. And colour is not enough. This month a chart turned green, but volume did not confirm, so the card stayed in cash. We do not predict. We react.
One card per asset, and Rotation
There is a card for Ethereum, Solana, Sui, Tesla and MicroStrategy. And there is Rotation: one card that chooses, every day, between Bitcoin, Ethereum, Solana, Sui, gold, or cash.
Make it yours
Open the catalog and filter what you care about. Follow the cards by hand, in your own exchange. If you prefer, automate them with Signum. And your AI assistant can read the cards too: Strategya speaks MCP. Pick your asset. Check the card. Decide once.
See it on the site
Every figure on this page and in the video is a simulated backtest, not real performance, and not investment advice. Long/Short results are preliminary.
Strategya.pro