Bitcoin Drawdown History: Every Big Fall Since 2018
Bitcoin's drawdown history since 2018: seven falls of 25% or more, how long each recovery took, and what a written rule did. Simulated backtest.
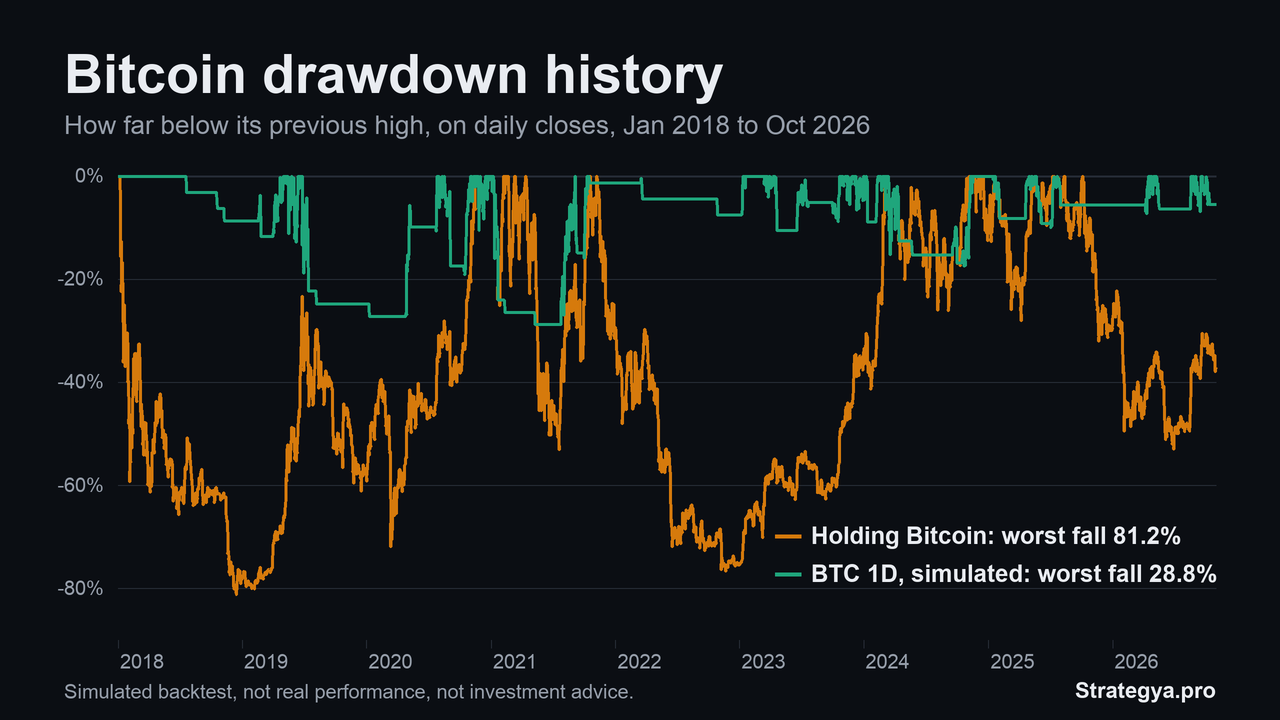
Table of contents
A drawdown is how far an investment sits below its previous high. It is the number that decides whether someone stays in a position, and it is easy to underrate on a long-term price chart.
Here is what Bitcoin's drawdowns have looked like since January 2018, how long each recovery took, and what one written rule did over the same years.
In 3 lines
- Bitcoin fell 25% or more seven times since January 2018, and four of those falls reached 50% or more.
- Getting back to the old high took from 31 days to 1,046 days. The latest fall has not recovered yet.
- A simulated, rule-based strategy had smaller drawdowns by spending most of the time in cash. That has a cost, and it comes with limits, both explained below.
How we measured this
We used daily closes of BTCUSDT from January 1, 2018 to October 31, 2026. Using closes makes these numbers milder than intraday lows. The data starts in 2018, so the high of December 2017 is not included, and the 2018 fall is measured from the first high in the data, on January 6.
Every Bitcoin fall of 25% or more since 2018
| Period | High | Low | Depth | Back at the high | Days, high to high |
|---|---|---|---|---|---|
| 2018 bear market | Jan 6, 2018 | Dec 15, 2018 | 81.2% | Nov 17, 2020 | 1,046 |
| January 2021 | Jan 8, 2021 | Jan 27, 2021 | 25.2% | Feb 8, 2021 | 31 |
| Spring 2021 | Apr 13, 2021 | Jul 20, 2021 | 53.1% | Oct 19, 2021 | 189 |
| 2022 bear market | Nov 8, 2021 | Nov 21, 2022 | 76.6% | Mar 4, 2024 | 847 |
| Mid 2024 | Mar 13, 2024 | Sep 6, 2024 | 26.2% | Nov 6, 2024 | 238 |
| Early 2025 | Jan 21, 2025 | Apr 8, 2025 | 28.1% | May 18, 2025 | 117 |
| Current | Oct 6, 2025 | Jun 30, 2026 | 53.0% | Not yet | 390 so far |
On October 31, 2026, Bitcoin closed 37.8% below its October 2025 high.
How long Bitcoin has spent below its high
Falls are only part of the story. The waiting is the other part. Since January 2018, on daily closes, Bitcoin was:
- below its previous high on 97.4% of days
- 20% or more below it on 74.6% of days
- 30% or more below it on 66.9% of days
- 50% or more below it on 35.0% of days
So a holder over these years spent about one day in three at least halfway below a previous high.
What a written rule did over the same years
BTC 1D is one of our strategies. It is a written trend-following rule, checked once a day at the candle close: long Bitcoin or in cash, and never short. The figures below are a simulated backtest with 0.1% commission per side. They are not real performance.
| Since 2023: max drawdown | Since 2023: multiple | Since 2018: max drawdown | Since 2018: multiple | |
|---|---|---|---|---|
| Holding Bitcoin | 53.0% | 4.67× | 81.2% | 5.80× |
| BTC 1D, simulated | 17.5% | 6.76× | 28.8% | 54.29× |
The worst fall of the rule was 28.8%, from January to May 2021. In the backtest, it never reached 30%.
Why you should not read too much into that table
A lower drawdown is not free, and this backtest has real limits:
- It spends most of the time out. The rule was long on 25.5% of days and in cash on the rest. Part of the time, that means watching Bitcoin rise from the sidelines.
- It still spends long stretches below its high. The simulated curve was below its previous high on 87.5% of days. One of those stretches lasted 397 days.
- It was built with hindsight. The current version of the rule dates from August 2026, so nearly all of this history was already known when it was tuned. Results from before that date are in-sample and say less than results from after it.
- The future can differ. A falls table describes the past. It does not say when the current fall ends, or whether it gets deeper.
See it on the site
- The BTC 1D strategy page shows every window, side by side.
- How a Strategya card works explains the daily card in two minutes.
- All strategies lists the other rule-based strategies.
Try everything free for 7 days, with no credit card: see how the trial works.
Every figure is a simulated backtest, not real performance, and not investment advice.
Strategya.pro