We backtested 8 popular TradingView indicators on Bitcoin since 2018
SuperTrend, UT Bot, Ichimoku, Gaussian Channel and four more, tested on Bitcoin, Ether and Solana with the same rules since 2018. Simulated backtest.
Table of contents
Every trader has a favorite indicator. SuperTrend, UT Bot, Ichimoku. They look great on a chart: a green line, a red line, buy here, sell there. The question nobody answers with numbers is simple: if you had followed the signals, without picking the good ones afterwards, how would you have done?
So we tested eight of the most popular free indicators on TradingView, on Bitcoin, Ether and Solana, with the same rules for all of them. The results are public and update every day at strategya.pro/benchmarks.
How we tested
- Daily Binance candles, from January 1, 2018 (Solana from August 2020).
- Long only: buy on the indicator's buy signal, go to cash on its sell signal. No leverage, no shorts.
- 100% of capital per trade, 0.1% commission each way, orders filled at the next day's open.
- Every indicator with its default settings. No tuning, no picking the best parameters after the fact.
- Each one checked against TradingView's own Strategy Tester. Our numbers match it within 0.5% in 29 of 30 cases (the last one, UT Bot on Solana, differs by 1.1%).
One caveat on Range Filter: its author tuned the default settings for 5-minute charts. We test everything on daily candles, so read its row with that in mind.
We left out indicators that repaint (their past signals change after the fact, so any backtest of them is fiction) and those that only draw levels without buy or sell signals.
The main number we use is MAR: the yearly return (CAGR) divided by the worst drop from a peak (max drawdown). It answers "how much did I earn for the pain I went through". Above 1 is good; below 0.5 means the ride was rough for what it paid.
Bitcoin, January 2018 to November 2026
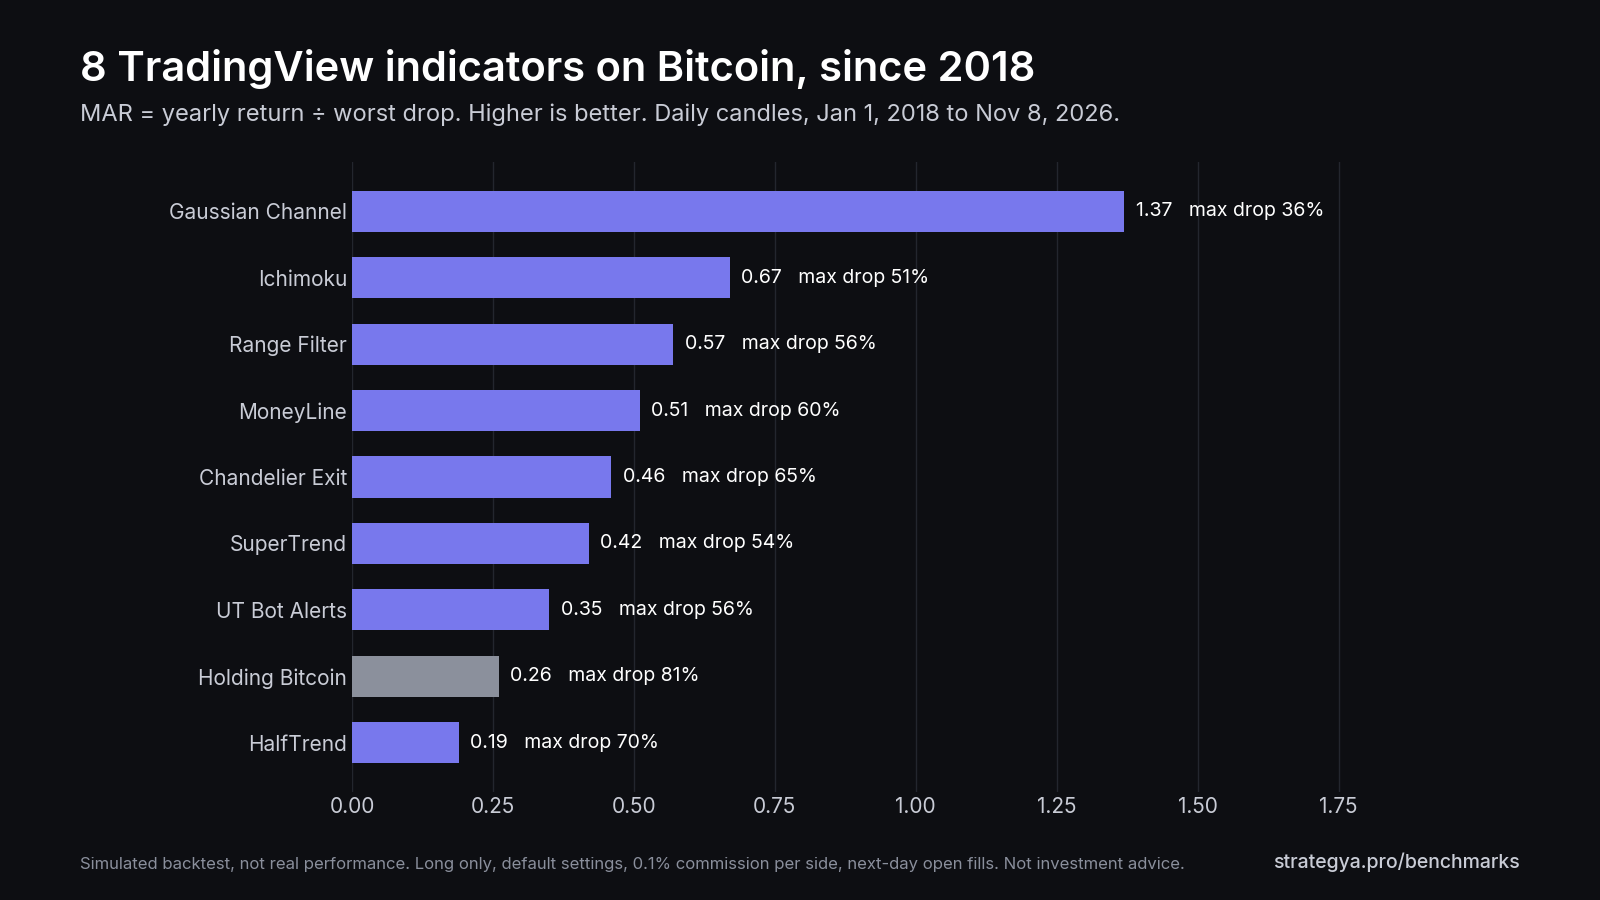
| Indicator | CAGR | Max drawdown | MAR | Trades | Last 12 months |
|---|---|---|---|---|---|
| Gaussian Channel | 50.0% | 36.5% | 1.37 | 55 | +11.6% |
| Ichimoku | 34.3% | 51.1% | 0.67 | 28 | −4.0% |
| Range Filter | 31.7% | 55.6% | 0.57 | 49 | +2.7% |
| MoneyLine | 30.6% | 60.0% | 0.51 | 35 | +2.1% |
| Chandelier Exit | 30.0% | 64.8% | 0.46 | 44 | +20.0% |
| SuperTrend | 22.6% | 53.6% | 0.42 | 38 | −0.7% |
| UT Bot Alerts | 19.5% | 56.4% | 0.35 | 174 | −17.7% |
| HalfTrend | 13.2% | 70.0% | 0.19 | 75 | −3.8% |
| Holding Bitcoin | 21.5% | 81.2% | 0.26 | — | −26.8% |
Simulated backtest, not real performance. Daily close-to-close curve; the real intraday drop would be larger. As of the November 8, 2026 close.
What we found
1. Almost all of them cut the pain. Holding Bitcoin since 2018 meant living through an 81% drop. Every indicator stayed between 36% and 70%. That alone is why trend-following exists.
2. Six of eight beat holding on return, but not by much. Holding Bitcoin earned 21.5% a year. Most indicators landed between 30% and 34%. Only one clearly stood out: the Gaussian Channel, with 50% a year and the smallest drawdown of the group.
3. The last year separated them. Bitcoin fell 26.8% over the last twelve months. Every indicator lost less than that, but most hovered around zero. Only Chandelier Exit (+20%) and Gaussian Channel (+11.6%) made real money.
4. Popular is not the same as good. UT Bot is one of the most liked scripts on TradingView. On Bitcoin it traded 174 times since 2018, paid commission on every one of them, and ended with the second-lowest MAR of the group.
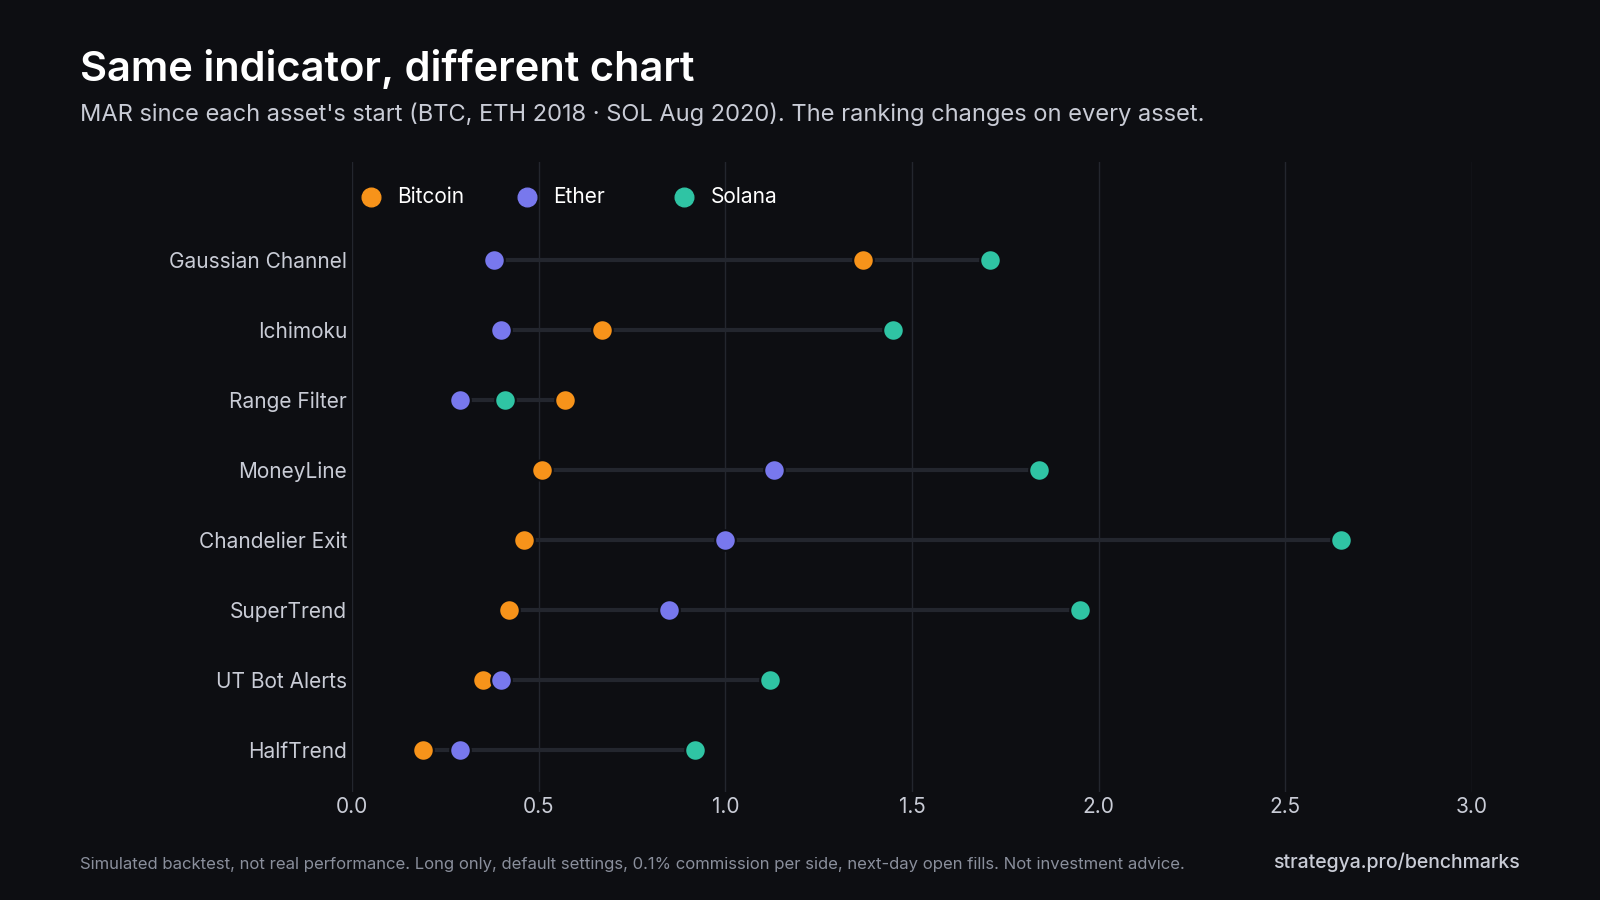
5. There is no universal winner. The same indicator behaves very differently on each asset. SuperTrend has a MAR of 0.42 on Bitcoin, 0.85 on Ether and 1.95 on Solana. On Ether the best of the eight was MoneyLine (1.13); on Solana, Chandelier Exit (2.65). An indicator that works on one chart proves nothing about the next one.
And our own strategies?
The same pages show our strategy for each asset next to the eight indicators. Our Bitcoin strategy shows a MAR of 1.98 since 2018 (57% a year, 29% max drawdown), and it leads in every recent window.
We have to be honest about why that comparison favors us. The indicators run with the settings their authors published years ago. Our strategies were calibrated on data that includes these same years. That makes our numbers look better than a fair, out-of-sample test would. The real test is the one ahead: every row of the benchmark keeps updating daily, in public, ours included.
We also added two free indicators of our own, Strategya.pro Line and Trend Engine. Trend Engine is the best performer on Bitcoin (MAR 2.13) and one of the worst on Solana (it lost money). It was designed on Bitcoin, and it shows. That is exactly the kind of thing a public benchmark should expose.
See every indicator, every asset, every window
Each benchmark has its own page with the rule we test, the chart with every entry and exit, results by window (6 months, 1 year, 2 years, since 2023 and since 2018), and today's position: in the market or in cash, and since when. If you want to automate one of them, each page links to a free JSON with today's signal.
Start here: strategya.pro/benchmarks
If you'd rather see the strategies we built to beat these numbers, you can try Strategya.pro free for 7 days, no credit card required.
All figures are simulated backtests, not real performance. Indicator logic belongs to its authors (credited on each page); the strategy rules are our own implementation with their default settings. Past results do not guarantee future results. None of this is investment advice.
Strategya.pro