Larsson Line: What It Is, and a Free Trend Line Backtested Since 2018
The Larsson Line is invite-only and closed source, so nobody outside can backtest it. We measured our own free trend line on Bitcoin, Ether and Solana instead. Simulated backtest.
Table of contents
If you follow crypto on X or YouTube, you have seen the Larsson Line: a colored line under the price that tells you, at a glance, whether the trend is up or down. It is one of the best known trend tools in the space.
We are not affiliated with CTO Larsson, and this post is not a review of his indicator. It answers a narrower question that people keep asking: can you measure a line like that, and what does a free one actually deliver?
What the Larsson Line is
According to its TradingView listing, the Larsson Line is a script by CTO Larsson built for trend trading of tech assets (tech stocks, bitcoin and other crypto) on long timeframes. It is always in one of three states: up, down or inconclusive.
It is also invite-only. Access is granted by the author, and the code is not public.
Why we do not publish a backtest of it
A backtest is only worth something if anyone can check it. With closed code, nobody outside can reproduce the signals bar by bar, and a number nobody can check is not a result.
There are community scripts that try to reconstruct it. Their own authors describe them as a guess. We do not measure a guess and put someone else's name on it.
What can be measured: a free trend line
The Strategya.pro Line answers the same question (is the trend up or down?) and is free with a Strategya.pro account. It goes long when a fast average crosses above a slow one and volume and money flow confirm.
We built it ourselves, by trial and error, from free and public trend scripts on TradingView. It is not the Larsson Line and it does not use its code.
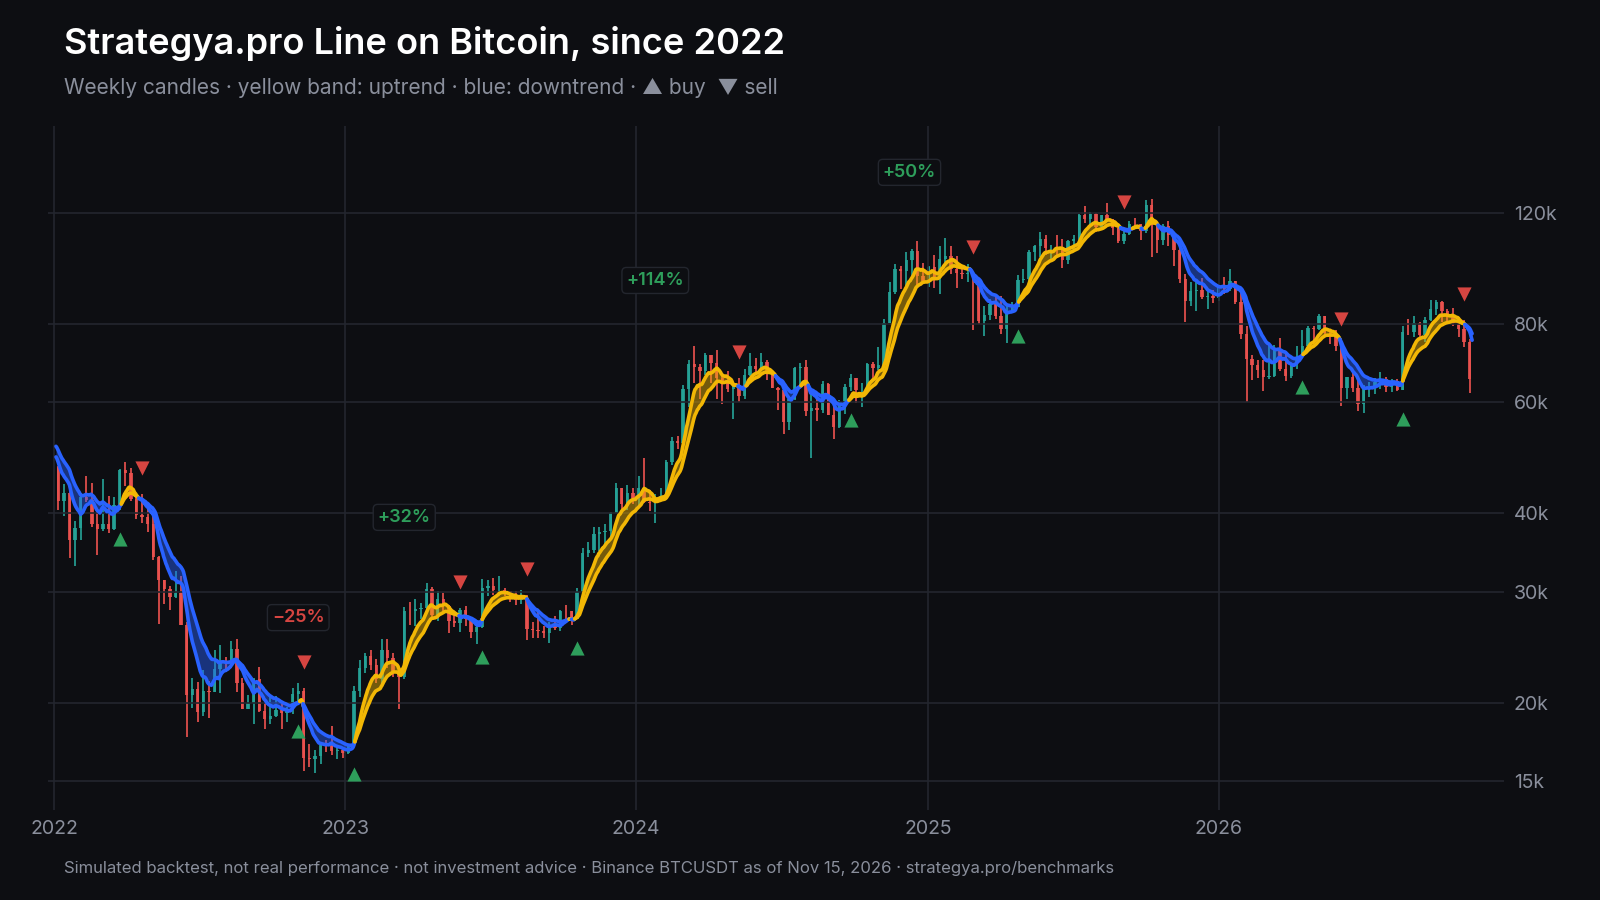
This is what it looks like on Bitcoin since 2022: the band turns yellow when the trend is up and blue when it is down, and the arrows mark every buy and every sell. It does not buy the bottom or sell the top. It catches the middle of the big moves and spends most of the long falls in cash, as in 2018 and 2022, although it took a 25% hit in each of them.
The rules
- Long only: buy when the line turns up, go to cash when it turns down.
- Daily candles, the line's own settings.
- 0.1% commission on every buy and every sell.
- From 2018 on Bitcoin and Ether, and from August 2020 on Solana, to November 15, 2026.
- Every result was checked against TradingView's Strategy Tester.
We compare it with simply buying and holding, using MAR: annual return divided by the worst drawdown. Higher is better.
The result
| Bitcoin | Ether | Solana | |
|---|---|---|---|
| Strategya.pro Line · MAR | 0.83 | 0.80 | 0.06 |
| annual return / max drawdown | 42.9% / 51.7% | 49.6% / 62.2% | 5.3% / 81.9% |
| Buy and hold · MAR | 0.24 | 0.11 | 0.66 |
| annual return / max drawdown | 19.6% / 81.2% | 10.5% / 94.0% | 63.9% / 96.3% |
Bold marks the better of the two. MAR since 2018 (Solana since 2020). Simulated backtest.
1. It beats holding on Bitcoin and Ether. A MAR of 0.83 against 0.24 on Bitcoin, and 0.80 against 0.11 on Ether.
2. It fails on Solana. A MAR of 0.06 is worse than simply holding the coin (0.66). We publish it because a benchmark that hides its bad row is an advertisement.
3. It cuts the worst of the drawdown, but it does not remove it. Holding Bitcoin meant an 81% drop at the worst point; with the line it was 52%. On Ether, 94% against 62%. That is still a deep drop.
4. One thing to keep in mind. We built the line looking at this same history. That is why we show it on three assets, including the one where it does badly.
What this means
A trend line is a rule, and a rule can be tested. Before you trust one, ours or anyone's, ask for the same thing: every trade, on more than one asset, with fees, and in a form you can check yourself.
The Strategya.pro Line has its own page with the rule, the chart with every entry and exit, results by window and today's position.
See it next to 22 other indicators: strategya.pro/benchmarks
At Strategya.pro each strategy comes from a rule tested per asset, with a daily card that says whether to be in or in cash. You can try them all free for 7 days, no credit card.
All figures are simulated backtests, not real performance. "Larsson Line" is the name of an indicator by CTO Larsson; Strategya.pro is not affiliated with, endorsed by or connected to him, and this post does not measure his indicator. Past results do not guarantee future results. None of this is investment advice.
Strategya.pro