Bitcoin at $54,000? Three clues to the bottom and one uncomfortable truth
Bitcoin fell 29% from its September high. We checked three clues to the bottom: the realized price, Fibonacci and volume. Nobody knows the low, so we react.
Table of contents
Two months ago Bitcoin was at $87,396. This weekend it touched $62,006.
That is 29% down in 55 days, right after a rally that had climbed 51% from the July low. Measured from the all-time high of October 2025, $126,200, Bitcoin is now down more than half.
Same story as always: whoever bought in September is angry, whoever sold in July feels like a genius, and everyone is asking the same question.
Where is the bottom?
There is no shortage of answers. We checked three of the most popular clues against the data, and at the end we tell you what we do. Spoiler: we don't guess.
Clue 1: the realized price, near $54,000
The realized price is the average price at which every bitcoin in existence last moved. Roughly, it is the cost basis of the whole market. Today it sits at $53,910.
Analyst Benjamin Cowen recently pointed out that at the cycle lows of 2014, 2018, 2020 and 2022, Bitcoin ended up below that line. The logic is simple: the bottom comes when even the average buyer is losing money.
In 2026 Bitcoin came close twice and never touched it: $60,000 on February 6 and $57,800 on July 1. Today it is 13% above.
Does that mean it is going to $54,000? No. Cowen himself says he doesn't know where Bitcoin is headed. But if history rhymes, there is a magnet there.
Clue 2: Fibonacci, $57,800 and then $39,000
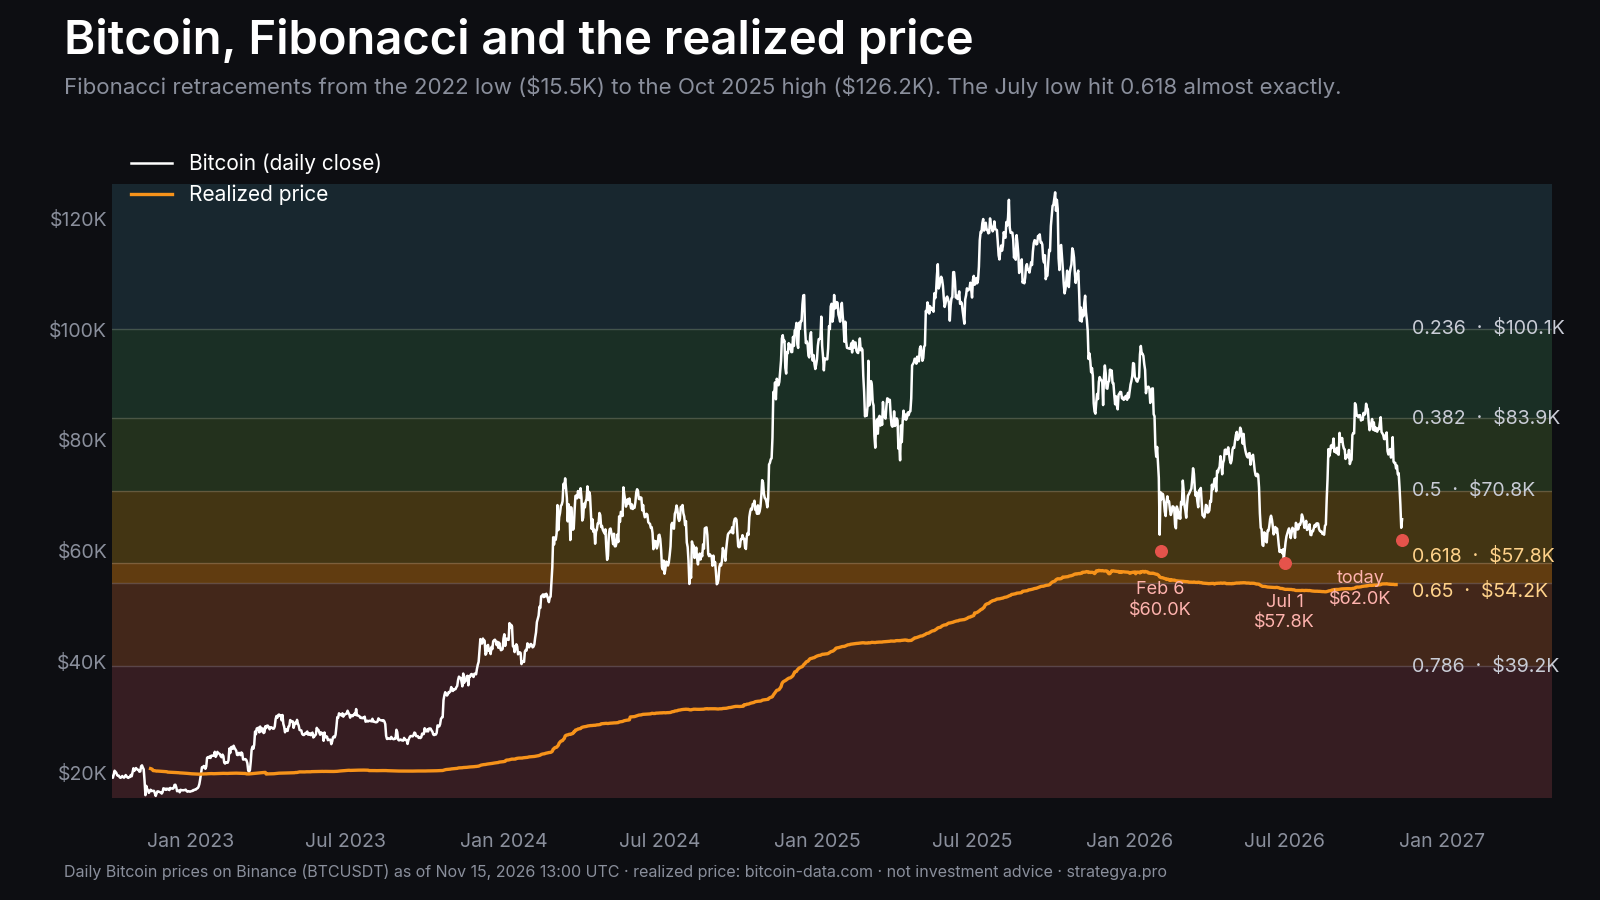
Fibonacci retracements are levels drawn between a low and a high, at ratios that show up again and again in nature: 23.6%, 38.2%, 50%, 61.8% and 78.6%. Many traders use them to estimate how far a rally can give back.
We took the 2022 low, $15,476, and the October 2025 high, $126,200. These are the levels that matter today:
| Level | Price |
|---|---|
| 0.5 | $70,838 |
| 0.618 | $57,772 |
| 0.65 | $54,229 |
| 0.786 | $39,171 |
Here is the curious part: the July 1 low was $57,800, just $28 above the 0.618 level. And the band between 0.618 and 0.65, which traders call the "golden pocket", runs from $57,800 to $54,200: right where the realized price sits.
Two different clues point to the same zone. If that zone breaks, the next Fibonacci level is $39,000.
Clue 3: volume, the one nobody watches
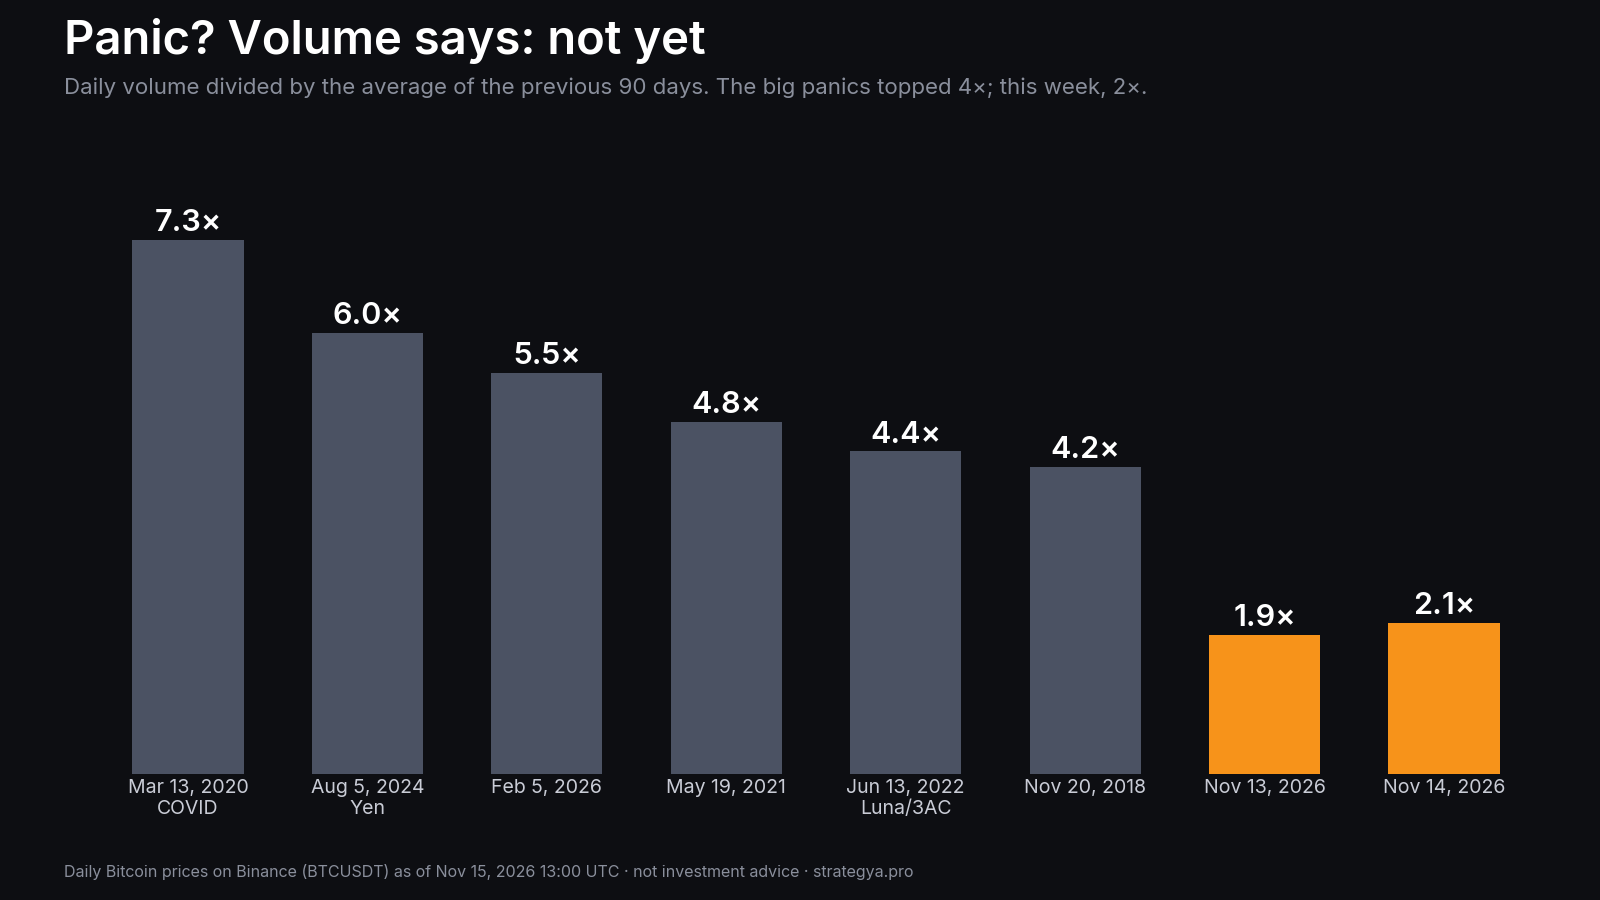
A real bottom usually comes with capitulation: a day of panic when everyone sells at once. That day shows up in the volume.
We compared each day's volume with its average over the previous 90 days:
- COVID, March 2020: 7.3 times normal.
- The yen unwind, August 2024: 6 times.
- February 5 this year: 5.5 times.
- This week, November 13 and 14: just 1.9 and 2.1 times.
In other words, there is fear, but no panic yet. If you are waiting for a classic capitulation, you haven't seen it.
One caveat: the final lows of 2018 and 2022 came on quiet days, at 0.9 and 1.1 times normal volume, weeks after the panic. Volume tells you when there is fear, not which day is the bottom.
What nobody knows
The four-year cycle said something else. From the 2017 high to the 2018 low took 363 days; from the 2021 high to the 2022 low, 376. Counting from the October 2025 high, the bottom was due in the first half of October 2026.
October came and went, and Bitcoin is lower now than it was then.
The realized price says $54,000. Fibonacci says $57,800 or $39,000. Volume says the panic hasn't come. The cycle says the bottom should already be behind us. All four clues are reasonable, and they don't agree.
That is the uncomfortable truth: nobody has a crystal ball.
What we do: react
At Strategya.pro we don't predict the bottom. We follow rules that check the market once a day and answer a single question: in or cash?
Today all 25 cards in the catalog are in cash. These sold before the drop. "Change" is how far the asset moved from the sale to November 15:
| Card | Sold | Price | Change |
|---|---|---|---|
| BTC 1D | Oct 13 | $81,850 | −19.8% |
| ETH 1D | Oct 8 | $2,574 | −28.7% |
| SOL 1D | Oct 8 | $116.3 | −37.2% |
| SUI 1D | Oct 18 | $0.976 | −24.7% |
So far in 2026, holding Bitcoin is down 26.8% and the BTC 1D rule is up 25.9% (simulated backtest, as of the November 14 close).
Will it buy the exact bottom? No. No trend rule buys the bottom: it buys when the trend turns, a little higher. In exchange, it doesn't need to guess.
A confession. After the July low, the BTC 1D rule bought on August 20. One of Strategya's founders ignored it: he hadn't seen capitulation volume and didn't believe the bottom, so he stayed in cash. The rule sold on October 13 at +17.8%, and he missed it. The lesson is not that the rule is always right, because it isn't. It's that gut feeling isn't either.
Why this is good news
Crypto markets are cyclical. There are rallies and there are drops, and the drops are the part of the cycle where the next rally is built. If you have a plan, this is not a tragedy: it is the part of the cycle you have to know how to wait through.
The question is not "will it reach $54,000?". The question is what you will do when the trend turns, whether at $54,000, at $39,000 or tomorrow.
Our cards tell you once a day. You can see them all free for 7 days, no credit card.
Simulated backtest, not real performance. Past results do not guarantee future results. Nothing here is investment advice. Daily Bitcoin prices on Binance (BTCUSDT) as of November 15, 2026, 13:00 UTC. Realized price: bitcoin-data.com, as of November 8. Benjamin Cowen's point is from this video (minutes 9:58 to 12:52).
Strategya.pro