Moving-Average Crossover vs Strategya on Bitcoin, 2018 to 2026
Same Bitcoin data, same costs: holding, a classic EMA crossover with volume filters, and Strategya BTC 1D, since 2018 and since 2023. Simulated backtest, with the drawdowns.
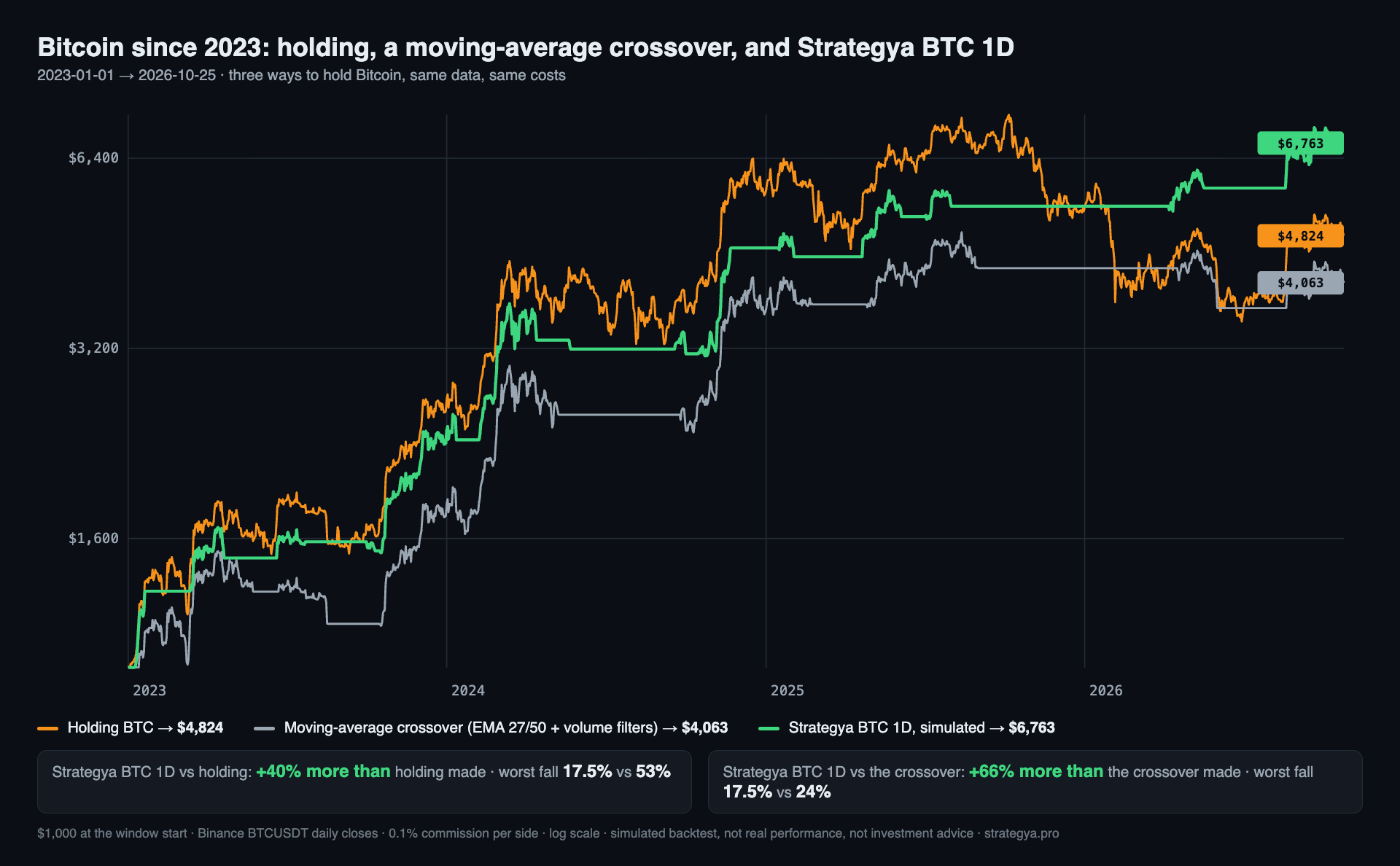
Table of contents
People ask us a fair question: is a rule-based Bitcoin strategy really better than a simple moving-average crossover, or than just holding? Here is the comparison, on the same data and with the same costs, so you can see it yourself.
In 3 lines
- Since 2023, $1,000 became $4,824 by holding Bitcoin, $4,063 with a classic crossover, and $6,763 with Strategya BTC 1D. The worst falls on the way: 53%, 24% and 17.5%.
- Since 2018 the gap is wider: $5,991, $25,118 and $54,291, with worst falls of 81%, 52% and 29%.
- Everything below is a simulated backtest on past prices, not money that was made, and not investment advice. Both rules were designed with knowledge of part of this history.
The three ways to hold Bitcoin
Holding. Buy on the first day, never sell. The benchmark everything else has to beat.
A moving-average crossover. A classic rule, the kind that appears in every trading book: buy when the 27-day exponential average crosses above the 50-day one and volume confirms the move (price above its 5-day volume-weighted average, Money Flow Index between 47.5 and 73); sell when the fast average closes back below the slow one. Long or cash, never short, no stop loss. We built this one ourselves years ago as a baseline and still use it as one.
Strategya BTC 1D. Our published rule for Bitcoin. It is also a trend-following rule checked once a day at the close, long or cash and never short, but it reads the trend with a smoother engine and leaves the market sooner when the trend weakens. It is one of the strategies on the catalog; its position today is what subscribers see.
How we measured
Daily closes of BTCUSDT on Binance, from January 1, 2018 to October 25, 2026. $1,000 at the start of each window, 100% of the money in each trade, 0.1% commission per side, no slippage model. Drawdown is measured on daily closes, which is the harder of the two readings we publish. All three curves were run in the same backtest engine; Strategya's rule is additionally reconciled against TradingView trade by trade, the crossover baseline is not.
Since 2023
| 2023 → Oct 2026 | Holding BTC | MA crossover | Strategya BTC 1D |
|---|---|---|---|
| $1,000 became | $4,824 | $4,063 | $6,763 |
| Multiple | ×4.82 | ×4.06 | ×6.76 |
| CAGR | 51% | 44% | 65% |
| Worst fall | 53.0% | 24.2% | 17.5% |
| MAR (return / worst fall) | 0.96 | 1.84 | 3.73 |
| Closed trades | 1 | 6 | 14 |
| Winning trades | — | 67% | 71% |
| Time in the market | 100% | 52% | 35% |
The crossover did its job on risk: it cut the worst fall in half. But it paid for it with return. It sat out the start of 2023, got whipsawed in the sideways months of 2024, and ended below holding. Strategya made more trades, was in the market only a third of the time, and still ended well ahead with the smallest fall of the three.
Since 2018
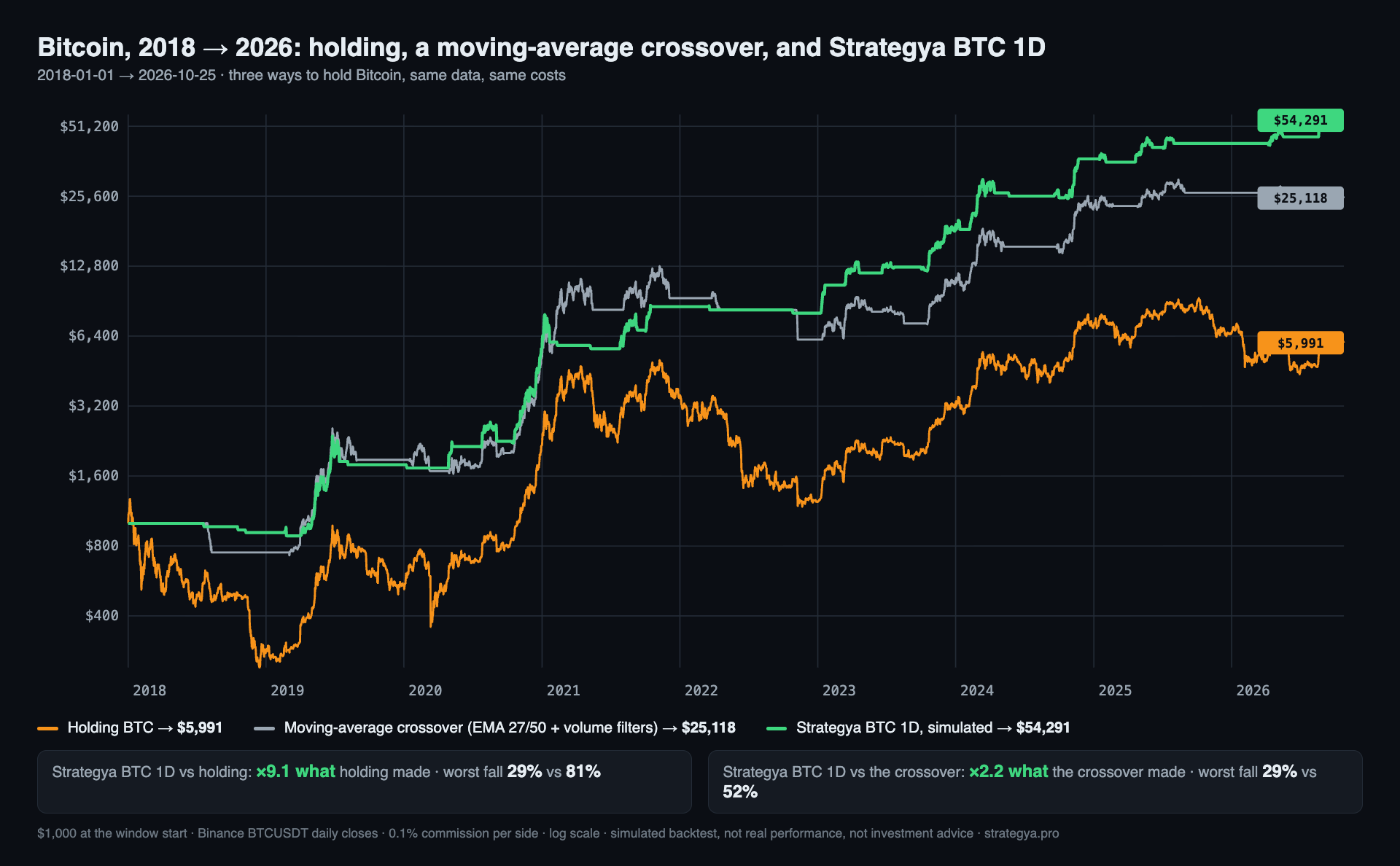
| 2018 → Oct 2026 | Holding BTC | MA crossover | Strategya BTC 1D |
|---|---|---|---|
| $1,000 became | $5,991 | $25,118 | $54,291 |
| Multiple | ×5.99 | ×25.1 | ×54.3 |
| CAGR | 23% | 44% | 57% |
| Worst fall | 81.2% | 51.7% | 28.8% |
| MAR (return / worst fall) | 0.28 | 0.85 | 1.99 |
| Closed trades | 1 | 15 | 30 |
The long window is where the difference between the two rules shows. The crossover avoided most of the 2018 bear market, which is why it ends four times above holding. But in 2022 it still lost 34% and, over the whole span, it fell 52% from a peak at one point. Strategya's worst fall over the same nine years was 29%.
Year by year
| Year | Holding BTC | MA crossover | Strategya BTC 1D |
|---|---|---|---|
| 2018 | −72% | −25% | −9% |
| 2019 | +94% | +150% | +96% |
| 2020 | +302% | +174% | +216% |
| 2021 | +60% | +81% | +52% |
| 2022 | −64% | −34% | −6% |
| 2023 | +156% | +74% | +127% |
| 2024 | +121% | +110% | +104% |
| 2025 | −6% | +17% | +16% |
| 2026 to Oct 25 | −9% | −5% | +26% |
No rule wins every year. Holding won 2020, 2023 and 2024 outright; the crossover won 2019 and 2021. What separates the three is what happens in the bad years: 2018, 2022 and the current one.
What the crossover gets right, and where it fails
It gets the big idea right: a written rule that steps aside in a bear market beats holding over a full cycle, even a simple one. Where it fails is in the details that decide the drawdown. It reacts late, so it gives back a large part of each trend before it exits; it is easily whipsawed in sideways markets, which is what 2024 looked like; and it has no exit other than the crossover itself.
Strategya's rule changes those details: a smoother read of the trend, a quicker exit when the trend breaks, and a hard stop. The cost is more trades, 30 against 15 since 2018, with the commissions that come with them, already included above.
Limits of this comparison
- A backtest is a simulation on past prices. It shows how a rule would have behaved, not what it will do.
- Both rules were designed with knowledge of part of this history. A rule that looks great on the years it was built on can disappoint on the next ones. That is why we publish the full history, not a chosen window.
- Drawdowns on daily closes are milder than intraday lows. Real falls felt worse.
- None of this is investment advice. Bitcoin can lose most of its value, with or without a rule.
See it on your own numbers
The Simulator scales each published strategy to the amount you choose, and the Lab lets you replay BTC 1D trade by trade against the price. If you want to see what the rule says today, try everything free for 7 days. No credit card: create your account and confirm your email.
Simulated backtest · not real performance · not investment advice.
Strategya.pro