Why Bitcoin's M2 Correlation Broke — and Why IGV Quietly Took Its Place
For years, Bitcoin's most repeated chart was a simple one: BTC overlaid on global M2 money supply. Crypto Twitter built an entire macro thesis on it — "BTC is liquidity, M2 leads by ~3 months, watch the chart." That trade worked. Until it didn't.
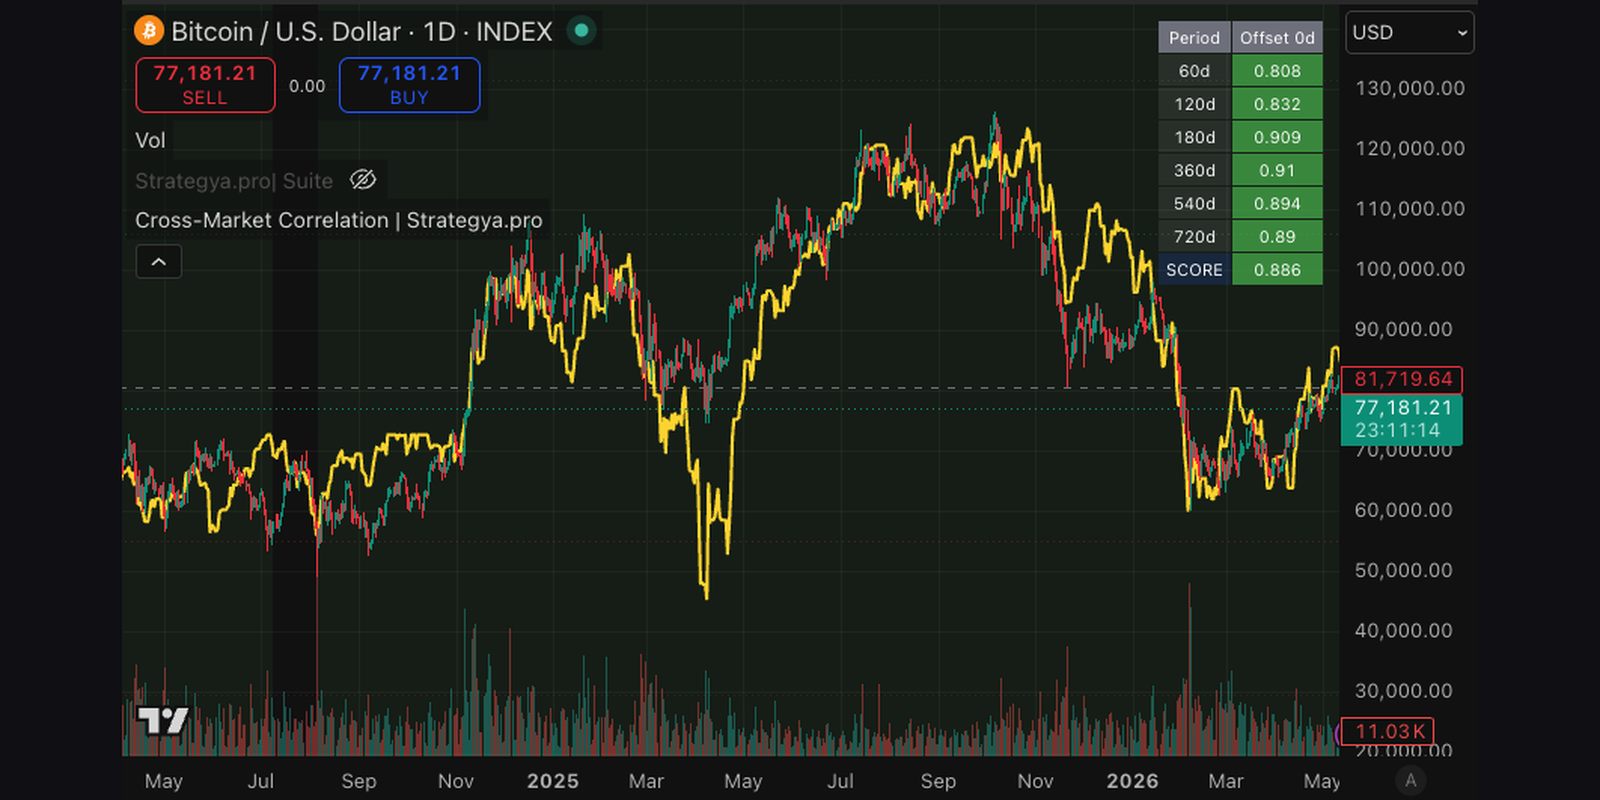
Table of contents
The M2 Trade Is Dying. Something Else Replaced It.
For years, Bitcoin's most repeated chart was a simple one: BTC overlaid on global M2 money supply. Crypto Twitter built an entire macro thesis on it — "BTC is liquidity, M2 leads by ~3 months, watch the chart."
That trade worked. Until it didn't.
> TL;DR — See it live: Open the BTC ↔ IGV chart on TradingView with all correlations pre-loaded → https://www.tradingview.com/chart/2FK7wvc1/
In 2025–2026, the M2 ↔ BTC visual started decoupling. M2 expanded — Bitcoin didn't follow. M2 stagnated — Bitcoin still moved on its own narratives (ETF flows, halvings, sovereign adoption). The "M2 leads BTC" framework began returning false signals more often than true ones.
So the obvious question became: what is actually driving BTC if M2 isn't?
We built a free TradingView indicator to answer that systematically.
Introducing: Cross-Market Correlation | Strategya.pro
We released Cross-Market Correlation | Strategya.pro as a free, open educational tool on TradingView. The premise is simple:
"Stop asking which asset leads Bitcoin. Let the data tell you."
The indicator runs Pearson correlation between your chart asset and any external symbol across six time horizons simultaneously:
Window | Use case |
60d | Tactical / short-term regime |
120d | Trend cycle |
180d | Quarterly macro pulse |
360d | Full annual cycle |
540d | Multi-year structure |
720d | Long-run regime |
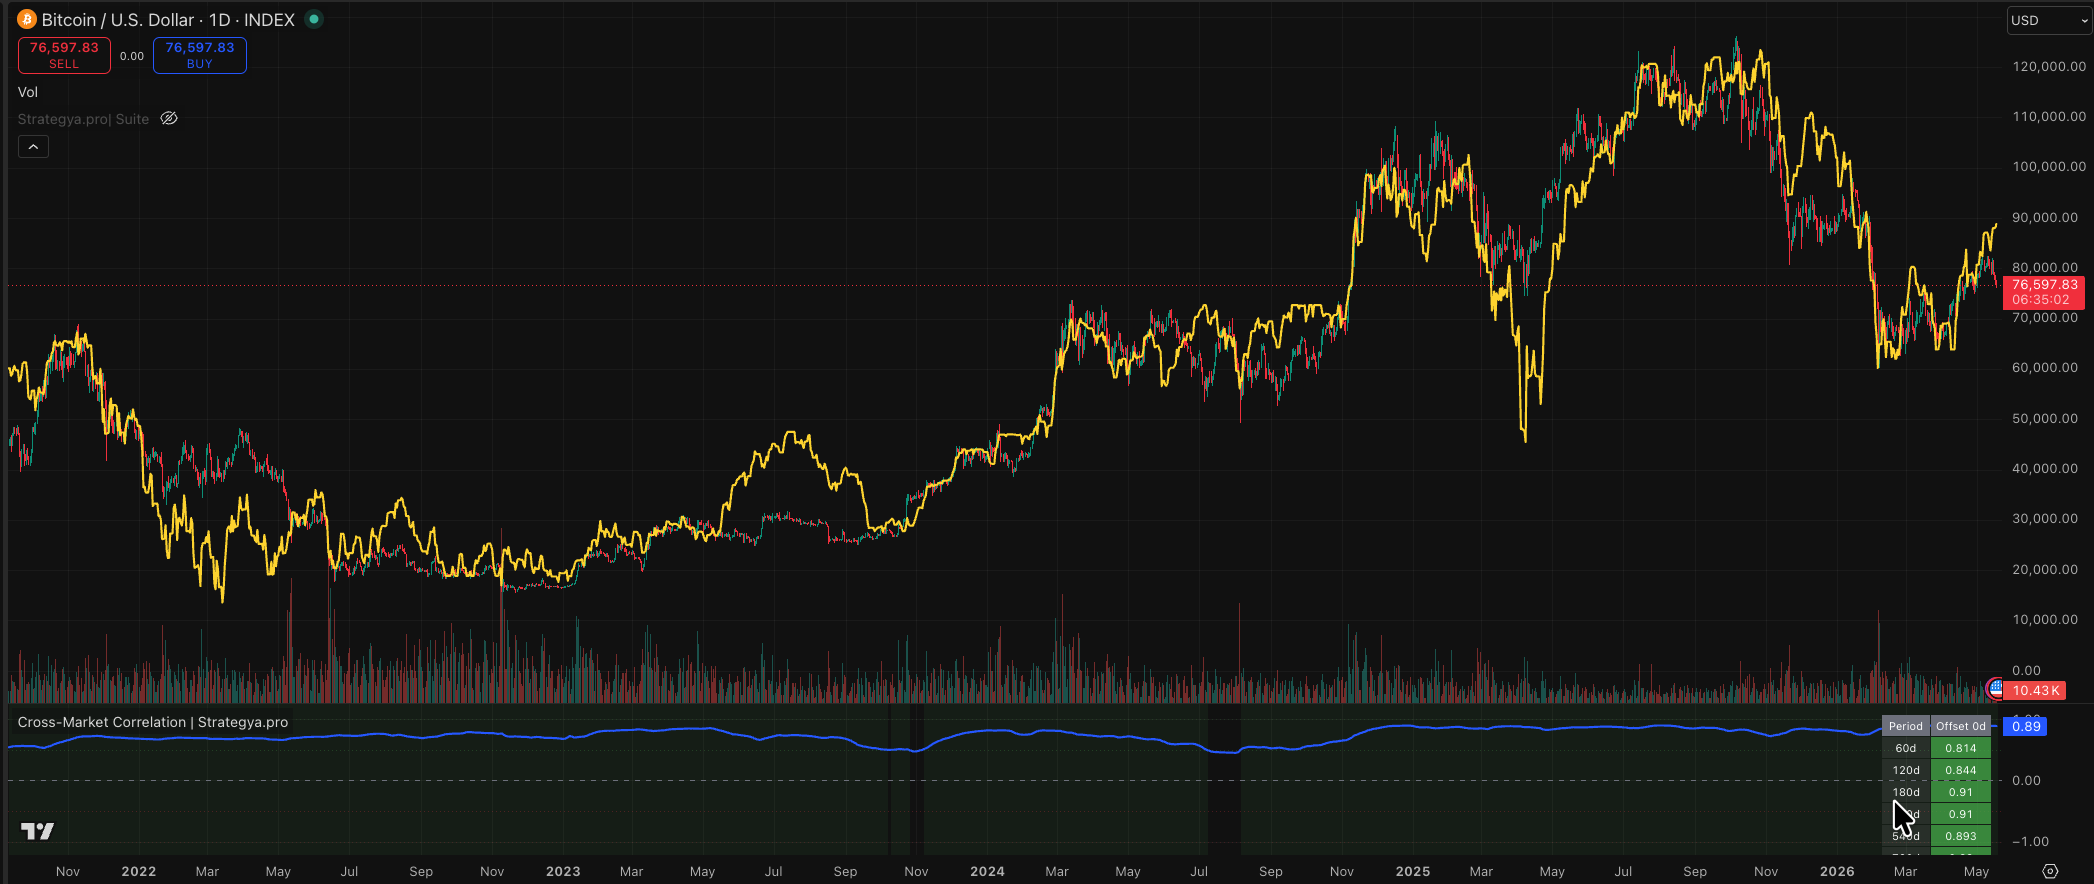
Each window is weighted (longer = more weight) into a single SCORE between -1.00 and +1.00. You can lag the external asset by up to 365 days to detect lead/lag relationships, and overlay two offsets simultaneously for comparison.
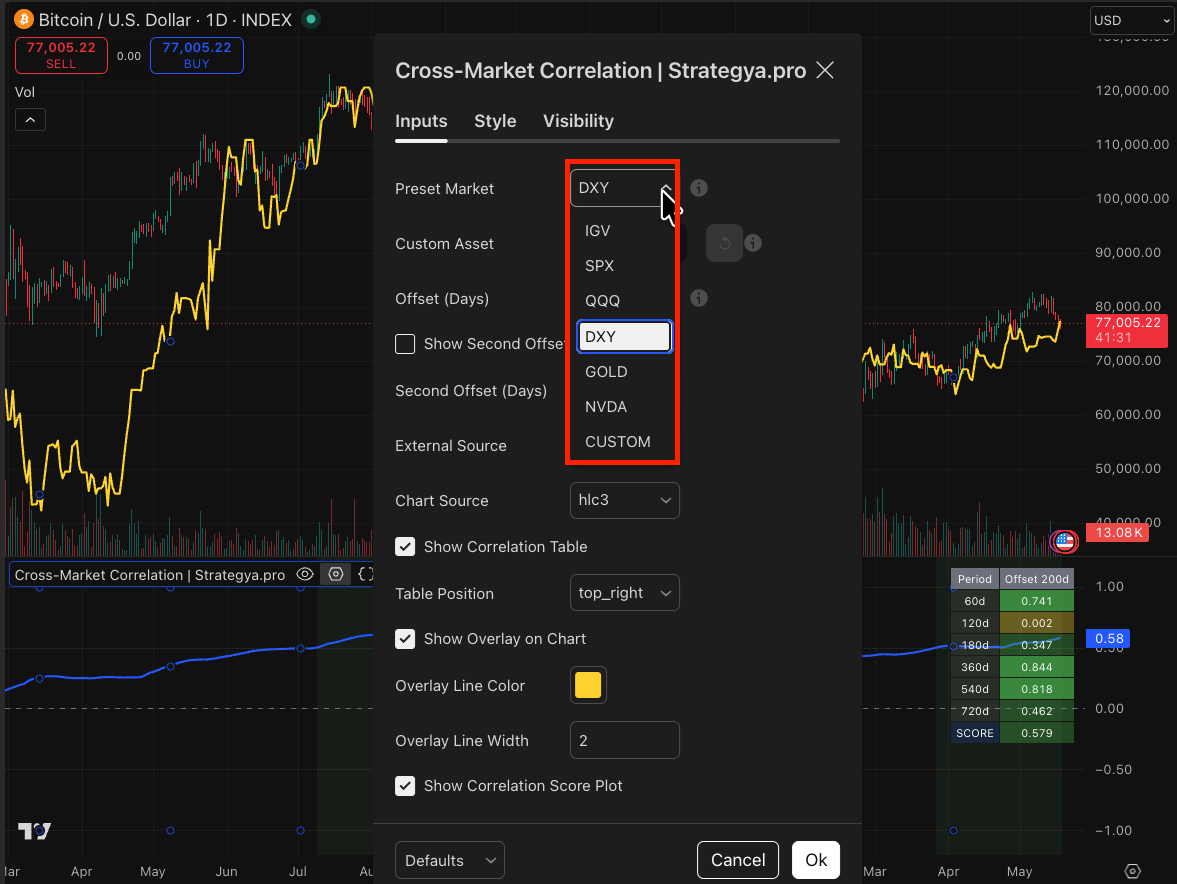
It works with any TradingView-supported symbol — but ships with 6 preset assets we found most informative for BTC analysis: IGV, SPX, QQQ, DXY, GOLD, NVDA.
What the Data Showed Us
We ran a systematic scan: for each preset asset, we tested every possible lag offset from 0 to 365 calendar days against INDEX:BTCUSD and recorded the offset that maximized the correlation score (positive or negative).
The results were striking.
Optimal Correlation per Asset vs BTC (May 2026)
Asset | Best Offset | Score | Direction |
IGV | 0 days | +0.890 | Positive |
DXY | 218 days | +0.606 | Positive (lagged) |
GOLD | 29 days | -0.527 | Negative |
NVDA | 144 days | -0.513 | Negative (long-term) |
QQQ | 145 days | -0.470 | Negative (long-term) |
SPX | 61 days | -0.461 | Negative (medium-term) |
Want to test it yourself? Open this exact chart on TradingView →https://www.tradingview.com/chart/2FK7wvc1/
The headline: IGV correlates with BTC at +0.89 with zero offset. That's not "moderate." That's not "interesting." That's structural.
By comparison:
IGV's correlation is 3x stronger than the next-best positive correlator (DXY, lagged)
The negative scores for SPX/QQQ/NVDA at long horizons reveal regime shifts, not stable anti-correlation
GOLD's negative score is consistent — confirming BTC doesn't trade as "digital gold" anymore
Why IGV? The Software-Beta Thesis
IGV is the iShares Expanded Tech-Software Sector ETF — a basket of pure-play software companies (Microsoft, Oracle, Salesforce, Adobe, ServiceNow, etc.).
So why does Bitcoin — supposedly the anti-establishment, decentralized, hard-money asset — track a software ETF almost perfectly?
The answer is about what Bitcoin has become, not what it was designed to be.
BTC Is Now a Duration / Liquidity Beta Trade
Looking at historical correlation across macro regimes:
Macro Regime | BTC ↔ IGV Correlation |
ZIRP / QE Era (2010–2015) | +0.03 |
Powell Tightening I (2016–2018) | +0.06 |
COVID Liquidity Flood (2019–2021) | +0.29 |
Aggressive Tightening (2022) | +0.56 |
Disinflation + AI Boom (2023–2024) | +0.29 |
Late-Cycle Slowdown (2025–2026) | +0.43 |
Bitcoin's correlation with software equities has risen 15x since 2010. In the 2022 bear market, BTC and IGV moved together at +0.56 — and BTC fell -71% while IGV fell -36%. That's a ~2x beta relationship.
The thesis is straightforward:
Both are high-duration assets — their value comes from long-dated future cash flows / adoption
Both are extremely sensitive to real yields — when TIPS yields rise, both compress
Both rally on liquidity expansion — M2 growth, Fed pivots, dovish surprises
Both have institutional ownership concentrated in the same risk-on portfolios
In other words: BTC didn't lose its M2 correlation — the correlation was always with the broader "liquidity / duration / growth" complex, and IGV is now the cleanest expression of that complex.
What About Seasonal Patterns? We Tested Midterms Too.
Crypto and equity influencers love seasonal narratives. "Midterm year bullishness," "Q4 rally," "post-election rally." So we tested one specifically: does IGV reliably rally from May to December in US midterm election years?
We ran the backtest from 2002 to 2022 (six midterm cycles since IGV's inception):
Year | Start Price | End Price | Return |
2002 | $6.21 | $4.84 | -21.95% |
2006 | $8.12 | $8.65 | +6.53% |
2010 | $9.66 | $11.34 | +17.38% |
2014 | $15.55 | $18.19 | +16.96% |
2018 | $34.77 | $34.49 | -0.82% |
2022 | $61.11 | $51.17 | -16.28% |
Aggregate stats:
Mean return: +0.30%
Median return: +2.85%
Win rate: 50% (literally a coin flip)
Standard deviation: 16.6%
Conclusion: The "midterm year rally" narrative for software stocks is statistically meaningless. Three of the six years were strongly positive. Three were neutral-to-strongly-negative. The mean is essentially zero.
Look closer at the losing years — 2002, 2018, 2022 — and a pattern emerges that has nothing to do with elections:
2002: Post-dot-com bust, late tightening
2018: Q4 2018 Powell tightening shock
2022: Aggressive Fed hikes, real yields breaking out
The "midterm effect" doesn't drive returns. The macro regime does. Always.
What This Means in the Current Macro Setup (May 2026)
If BTC tracks IGV at +0.89, and IGV is driven by macro regime, then understanding the current regime is the only thing that matters for both assets.
Let's check the actual data, not vibes.
The Fed Reality (March 2026 Dot Plot)
Median 2026 projection: One 25bps cut for the entire year
4 FOMC members: zero cuts in 2026
3 FOMC members: possible hike back up
PCE inflation forecast revised UP: 2.7% (vs 2.4% in December 2025)
Core PCE: also revised up to 2.7%
Current fed funds rate: 3.5%–3.75%
Translation: there is almost zero room for easing, and the risk skew is to more restrictive, not less.
The Iran War Reality
War initiated early March 2026
Brent crude: spiked to $113+, currently hovering near $100 with fragile peace talks
Strait of Hormuz: closure remains a live tail risk
DXY: reversed from YTD lows of ~95 back to ~99 on safe-haven flow
• IEA officially calls this "the greatest global energy security challenge in history"
Updated Macro Vectors for IGV (and therefore BTC)
Variable | Status | Impact |
Fed cuts 2026 | One cut max, possibly zero | 🔴 Bearish |
Fed cuts 2027 | Inflation revised up — limited | 🔴 Bearish |
DXY trend | Reversed higher on war premium | 🔴 Bearish |
Oil prices | $100+ with $130 tail risk | 🔴 Bearish |
Inflation outlook | Sticky, not disinflating | 🔴 Bearish |
The five core macro vectors that would drive risk-on for software (and therefore BTC) have all moved in the wrong direction since the start of 2026.
The Implication
If you've been waiting for the M2 correlation to "come back" to justify being long BTC — you may be waiting for the wrong signal.
The signal is IGV.
And right now, IGV is:
Down -8% YTD while QQQ is +40% (concentration in mega-caps, broad software weakness)
Trading in a regime where Fed is structurally restrictive
Facing geopolitical pressure that's strengthening DXY and elevating oil
For Bitcoin, which trades as roughly 2x beta on IGV in stress regimes, this is not a setup that historically rewards exposure additions.
The only catalyst that flips this setup is a clean and rapid resolution of the Iran war — which would normalize oil, weaken DXY, and re-open the door to risk-on flows. That's a real but uncertain scenario.
Until then, the data is what it is.
What to Monitor (Watchlist)
If you use the Cross-Market Correlation indicator, here are the variables we track most closely:
IGV/QQQ ratio — if IGV keeps losing relative strength, broad tech is fragile
DXY direction — sustained breaks above 105 or below 95 are regime inflection points
NVDA + hyperscaler capex guidance — first cracks in the AI cycle
Real yields (10y TIPS) — the cleanest correlate to growth/duration valuations
HY credit spreads — early warning system for risk-off
When these move in concert, BTC follows.
Get the Indicator
Cross-Market Correlation | Strategya.pro is available for free on TradingView. Add it to any chart, select a preset asset (or paste any TradingView symbol), and start mapping correlations across horizons.
It won't give you trade signals. It won't predict price. It will help you understand which macro lens to look through.
See the indicator working live (no signup):
https://www.tradingview.com/chart/2FK7wvc1/
Final Note
We don't publish predictive indicators. We publish analytical lenses. The market doesn't reward people who follow signals — it rewards people who understand what regime they're in.
Right now, BTC is a high-beta software trade. That can change. When it changes, the indicator will show it first.
Educational content only. Past correlations do not guarantee future relationships. This is not financial advice.
Sources